|
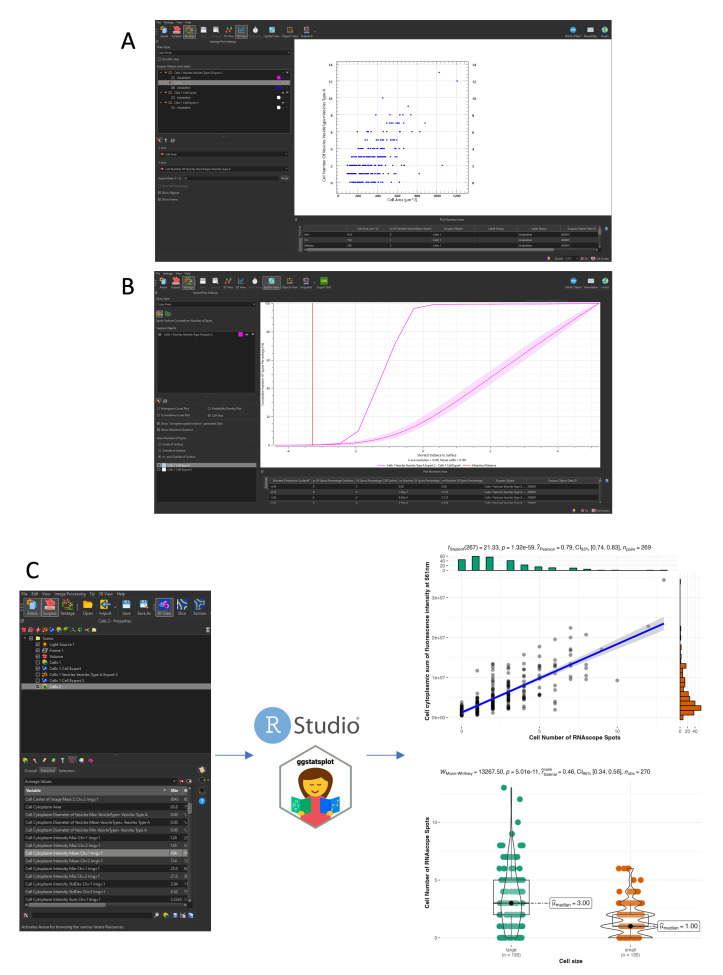
Figure 9. Spatial analysis and plotting of gene expression data.
All data plotted are extracted from a single caudal hematopoietic tissue (CHT) z-stack showing the expression of

|
|
Figure 9. Spatial analysis and plotting of gene expression data.
All data plotted are extracted from a single caudal hematopoietic tissue (CHT) z-stack showing the expression of