FIGURE SUMMARY
Title

Dapagliflozin ameliorates Lafora disease phenotype in a zebrafish model

Authors
Della Vecchia, S., Imbrici, P., Liantonio, A., Naef, V., Damiani, D., Licitra, R., Bernardi, S., Marchese, M., Santorelli, F.M.
Source
Full text @ Biomed. Pharmacother.

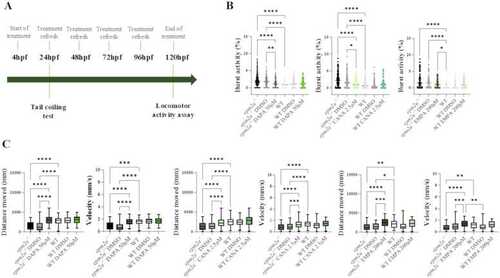
(A) Schedule of treatment with gliflozins. (B) Analysis of the effects of gliflozins on coiling behaviour of
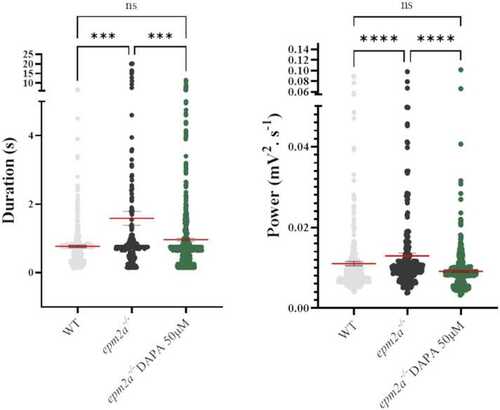
 epm2a−/− and WT embryos at 30 hpf. The experiments were performed in triplicate. The number of larvae in each group ranges from a minimum of 40 to a maximum of 300. The graphs represent the median and standard error of the mean (SEM). (C) Analysis of the effects of gliflozins on locomotion (distance travelled and velocity) in epm2a−/− and WT larvae at 5 dpf. The experiments were performed in triplicate. The number of larvae in each group ranges from a minimum of 40 to a maximum of 300. The graphs represent the median and SEM. Statistical analysis was performed using the Kruskal-Wallis test. Dunn’s test was used to perform post-hoc analysis for multiple comparisons after the Kruskal-Wallis test. (**** p ≤ 0.0001; ***p ≤ 0.001; **p ≤ 0.01; *p ≤ 0.05). Non-significant comparisons are not reported.

LFP recordings in WT (n = 14), epm2a−/− (n = 14) and DAPA-treated epm2a−/− (n = 14) animals. Violin plots of the duration (A) and power (B) of the seizure-like events detected in all epm2a−/− (n = 14) and DAPA-treated epm2a−/− (n = 14) fish. The red line represents the mean, and the black lines represent SEM. Statistical analysis was performed using the Kruskal-Wallis test. Dunn’s test was used to perform post-hoc analysis for multiple comparisons after the Kruskal-Wallis test. (****p ≤ 0.0001; ***p ≤ 0.001; **p ≤ 0.01; *p ≤ 0.05).

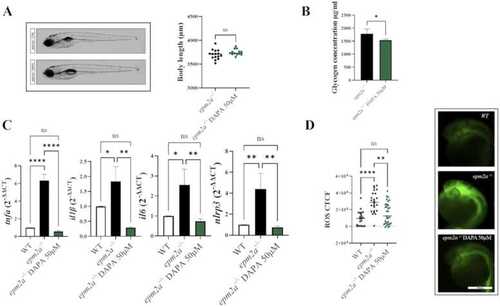
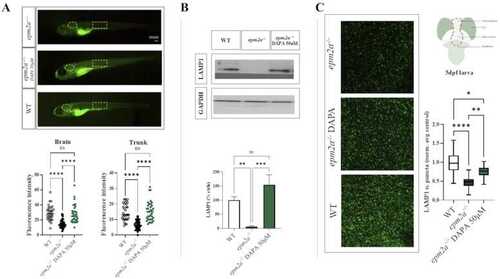
(A) Lateral view photographs of zebrafish larvae (epm2a−/−, n = 15, and DAPA-treated epm2a−/−, n = 13). Body length was compared between groups using Student’s t-test. Three independent experiments were performed for each experimental group (epm2a−/− and DAPA-treated epm2a−/− larvae). (B) Glycogen concentration, expressed in µg/mL, measured in epm2a−/− and DAPA-treated epm2a−/− larvae at 5 dpf. The values are expressed as mean ± standard deviation. Three independent experiments were performed for each experimental group (epm2a−/− and DAPA-treated epm2a−/− larvae). Statistical analysis was performed using Student’s t-test. (C) qRT-PCR analysis of inflammatory genes. Three independent experiments were performed for each experimental group (WT controls, epm2a−/− and DAPA-treated epm2a−/− larvae). Statistical analysis was performed using the ANOVA test. The values are expressed as mean ± standard error of the mean (SEM). (D) Representative fluorescence images of reactive oxygen species (ROS) production in controls (n = 21), epm2a−/− (n = 24) and DAPA-treated epm2a−/− (n = 31) larvae. Three independent experiments were performed for each experimental group (WT controls, epm2a−/− and DAPA-treated epm2a−/− larvae). Quantitative analysis of ROS production showed a significant increase in epm2a−/− larvae compared with controls and with DAPA-treated epm2a−/− larvae. Data are represented as individual values (lines as median ± SEM). Statistical analysis was performed using the Kruskal-Wallis test. Dunn’s test was used to perform post-hoc analysis for multiple comparisons after the Kruskal-Wallis test. (**** p ≤ 0.0001; ***p ≤ 0.001; **p ≤ 0.01; *p ≤ 0.05).

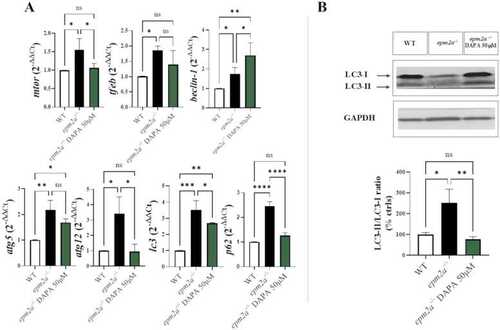
(A) qRT-PCR analysis of the autophagy-lysosomal pathway. Three independent experiments were performed per experimental group (WT controls, and epm2a−/− and DAPA-treated epm2a−/− larvae). Statistical analysis was performed using the ANOVA test. The values are expressed as mean ± standard error of the mean (SEM). (B) Three independent larval homogenates, from controls (n = 50), epm2a−/− larvae (n = 50) and DAPA-treated epm2a−/− larvae (n = 50), were tested by Western blotting for the expression of LC3 protein. The protein levels were normalized to GAPDH. Statistical analysis was performed using the ANOVA test. The values are expressed as mean ± SEM. (**** p ≤ 0.0001; ***p ≤ 0.001; **p ≤ 0.01; *p ≤ 0.05).

(A) In vivo LysoTracker staining in 5dpf WT, epm2a−/− and DAPA-treated epm2a−/− larvae with statistical analysis. Three independent experiments were performed in each group. The values are expressed as median ± standard error of the mean (SEM). Statistical analysis was performed using the Kruskal-Wallis test. Dunn’s test was used to perform post-hoc analysis for multiple comparisons after the Kruskal-Wallis test. Scale bar = 100 μm. (B) Three independent larval homogenates from controls (n = 50), epm2a−/− (n = 50) and DAPA-treated epm2a−/− larvae (n = 50) were tested by Western blotting for the expression of LAMP1. The protein levels were normalized to ß-actin or GAPDH. The values are expressed as mean ± SEM. Statistical analysis was performed using the ANOVA test. (C) LAMP1 whole-mount immunostaining in WT (n = 28), epm2a−/− (n = 35) and DAPA-treated epm2a−/− (n = 23) larvae at 5 dpf. Images were acquired with a confocal microscope with a magnification of 20x/zoom 2x. Scale bar 5 µm. On the right: quantification of LAMP1 puncta density ratio. The graph represents the median and SEM. Statistical analysis was performed using the Kruskal-Wallis test. Dunn’s test was used to perform post-hoc analysis for multiple comparisons after the Kruskal-Wallis test. (**** p ≤ 0.0001; ***p ≤ 0.001; **p ≤ 0.01; *p ≤ 0.05).

Acknowledgments
This image is the copyrighted work of the attributed author or publisher, and ZFIN has permission only to display this image to its users. Additional permissions should be obtained from the applicable author or publisher of the image. Full text @ Biomed. Pharmacother.