
IMAGE
Fig. 2
- ID
- ZDB-IMAGE-250207-56
- Publication
- Della Vecchia et al., 2025 - Dapagliflozin ameliorates Lafora disease phenotype in a zebrafish model
- All Figures
- Figures for Della Vecchia et al., 2025
Image
|
Figure Caption
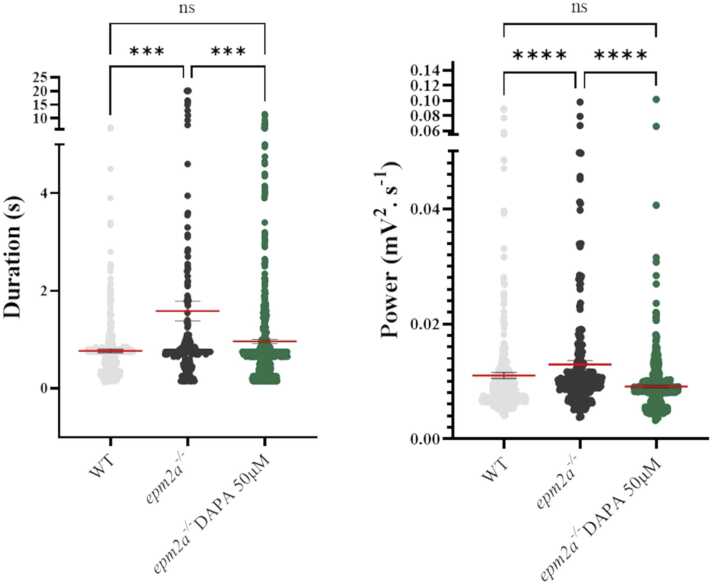
Fig. 2
LFP recordings in WT (n = 14),
Figure Data
Acknowledgments
This image is the copyrighted work of the attributed author or publisher, and
ZFIN has permission only to display this image to its users.
Additional permissions should be obtained from the applicable author or publisher of the image.
Full text @ Biomed. Pharmacother.