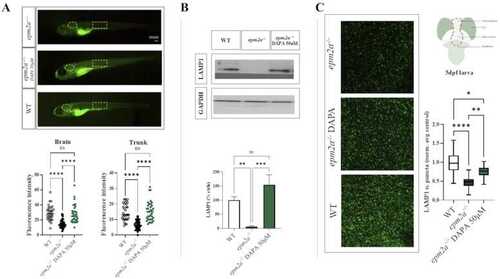
(A) In vivo LysoTracker staining in 5dpf WT, epm2a−/− and DAPA-treated epm2a−/− larvae with statistical analysis. Three independent experiments were performed in each group. The values are expressed as median ± standard error of the mean (SEM). Statistical analysis was performed using the Kruskal-Wallis test. Dunn’s test was used to perform post-hoc analysis for multiple comparisons after the Kruskal-Wallis test. Scale bar = 100 μm. (B) Three independent larval homogenates from controls (n = 50), epm2a−/− (n = 50) and DAPA-treated epm2a−/− larvae (n = 50) were tested by Western blotting for the expression of LAMP1. The protein levels were normalized to ß-actin or GAPDH. The values are expressed as mean ± SEM. Statistical analysis was performed using the ANOVA test. (C) LAMP1 whole-mount immunostaining in WT (n = 28), epm2a−/− (n = 35) and DAPA-treated epm2a−/− (n = 23) larvae at 5 dpf. Images were acquired with a confocal microscope with a magnification of 20x/zoom 2x. Scale bar 5 µm. On the right: quantification of LAMP1 puncta density ratio. The graph represents the median and SEM. Statistical analysis was performed using the Kruskal-Wallis test. Dunn’s test was used to perform post-hoc analysis for multiple comparisons after the Kruskal-Wallis test. (**** p ≤ 0.0001; ***p ≤ 0.001; **p ≤ 0.01; *p ≤ 0.05).
|
