
Fig. 5
- ID
- ZDB-IMAGE-250207-59
- Antibodies
- Publication
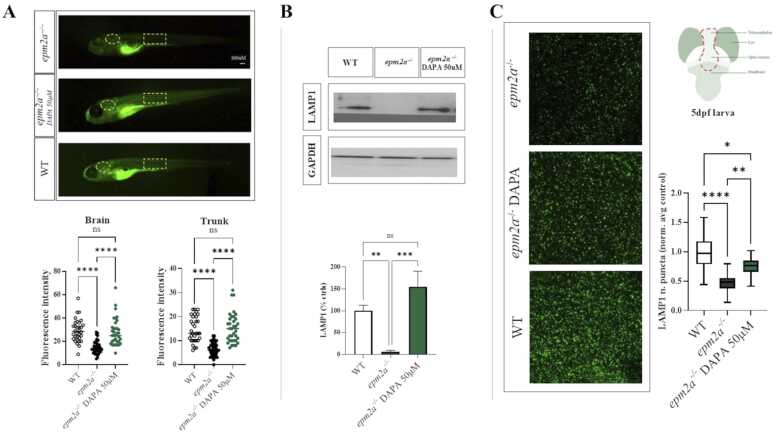
- Della Vecchia et al., 2025 - Dapagliflozin ameliorates Lafora disease phenotype in a zebrafish model
- All Figures
- Figures for Della Vecchia et al., 2025
|
Fig. 5
(A)