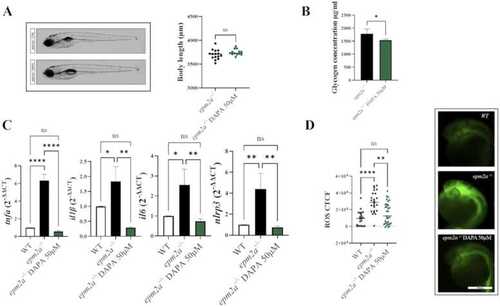
(A) Lateral view photographs of zebrafish larvae (epm2a−/−, n = 15, and DAPA-treated epm2a−/−, n = 13). Body length was compared between groups using Student’s t-test. Three independent experiments were performed for each experimental group (epm2a−/− and DAPA-treated epm2a−/− larvae). (B) Glycogen concentration, expressed in µg/mL, measured in epm2a−/− and DAPA-treated epm2a−/− larvae at 5 dpf. The values are expressed as mean ± standard deviation. Three independent experiments were performed for each experimental group (epm2a−/− and DAPA-treated epm2a−/− larvae). Statistical analysis was performed using Student’s t-test. (C) qRT-PCR analysis of inflammatory genes. Three independent experiments were performed for each experimental group (WT controls, epm2a−/− and DAPA-treated epm2a−/− larvae). Statistical analysis was performed using the ANOVA test. The values are expressed as mean ± standard error of the mean (SEM). (D) Representative fluorescence images of reactive oxygen species (ROS) production in controls (n = 21), epm2a−/− (n = 24) and DAPA-treated epm2a−/− (n = 31) larvae. Three independent experiments were performed for each experimental group (WT controls, epm2a−/− and DAPA-treated epm2a−/− larvae). Quantitative analysis of ROS production showed a significant increase in epm2a−/− larvae compared with controls and with DAPA-treated epm2a−/− larvae. Data are represented as individual values (lines as median ± SEM). Statistical analysis was performed using the Kruskal-Wallis test. Dunn’s test was used to perform post-hoc analysis for multiple comparisons after the Kruskal-Wallis test. (**** p ≤ 0.0001; ***p ≤ 0.001; **p ≤ 0.01; *p ≤ 0.05).
|
