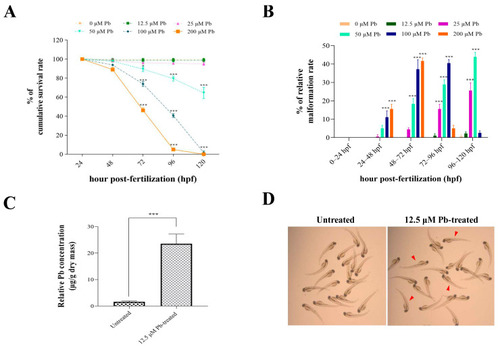
Physiological changes in developing zebrafish in response to acute lead exposure from 24 hpf to 120 hpf. (A) Survival rate of developing zebrafish after 96 h of exposure to nominal lead concentrations of 12.5 μM, 50 μM, 100 μM, and 200 μM, respectively. (B) Malformation rate of developing zebrafish after 96 h of exposure to lead. (C) Bioaccumulation in zebrafish larvae at 120 hpf after treatment with 12.5 μM lead; (D) Morphology of larval zebrafish at 120 hpf after treatment with 0 (control) and 12.5 μM lead for 96 h. Red arrowheads indicate representative normal larvae. Values represent the mean ± standard deviation of three biological replicates. * p < 0.05; *** p < 0.001.

Bioinformatic analysis of RNA-seq data. (A) Correlation of gene expression between untreated control and lead-treated groups. Red and green dots indicated up- and down-regulated genes, respectively. The blue dot referred to no significantly expressed genes. (B) Numbers of differentially expressed genes between control and lead treatments. Expression differences are displayed in different colors. Red indicates up-regulated genes, and green shows down-regulated genes.

qRT-PCR experiment validated the expression of sixteen DEGs, including mt2 (A), slc2a11l (B), sult1st5 (C), txn (D), prdx1 (E), rrad (F), timp2b (G), serpine1 (H), socs3b (I), cbx7a (J), hspb9 (K), gsr (L), dao.1 (M), fads2 (N), gck (O), and zgc:174917 (P). (Q) Scatterplots for fold change in gene expressions were performed by RNA-seq versus qRT-PCR results. The straight reference line in red indicates a linear relationship between the data of RNA-seq and qRT-PCR (p < 0.01, correlation coefficient = 0.971). Error bars represent the standard deviation of three biological replicates. * p < 0.05; ** p < 0.01; *** p < 0.001.

GO term enrichment of significant DEGs in untreated control and lead-treated groups. Bubble plots indicate enriched GO terms in the up-regulated (A) and down-regulated (B) genes. The Y axis denotes GO terms, whilst the X axis designates the rich factor. Rich factor refers to the ratio of DEGs relative to all genes subjected to GO annotation, and the higher the rich factor, the greater the intensity. The input number indicates the number of DEGs enriched in a specific GO term.

Gene expression profiling in larval zebrafish upon micromolar mercury and lead exposure. (A) Venn diagrams represent the number of up-regulated and down-regulated genes. Genes that change their expression in zebrafish larvae exposed to mercury are shown in a black circle. Genes that change their expression in zebrafish larvae exposed to lead are displayed in a green circle. Genes that are commonly regulated by mercury and lead are shown in a yellow oval. (B) Hierarchical clustering analysis based on gene expression profiles. Red shows up-regulated expression, while green represents down-regulated expression. Each column indicates different treatment groups, and each horizontal line refers to a gene. The color scale shows fold changes in gene expression.

Acknowledgments
This image is the copyrighted work of the attributed author or publisher, and ZFIN has permission only to display this image to its users. Additional permissions should be obtained from the applicable author or publisher of the image. Full text @ Animals (Basel)