
Image
|
Figure Caption
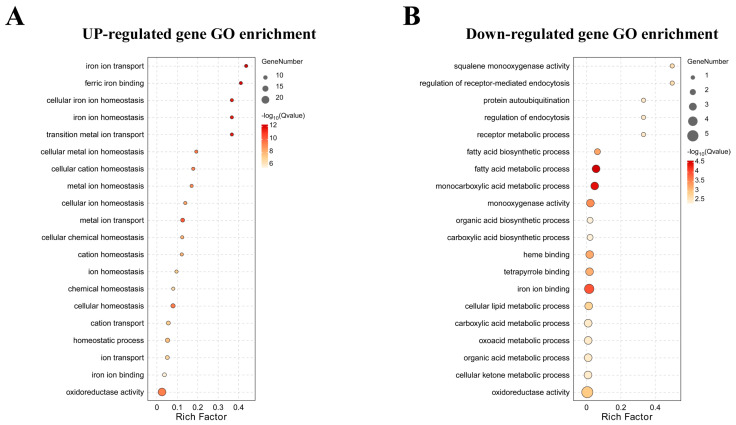
Figure 4
GO term enrichment of significant DEGs in untreated control and lead-treated groups. Bubble plots indicate enriched GO terms in the up-regulated (
Acknowledgments
This image is the copyrighted work of the attributed author or publisher, and
ZFIN has permission only to display this image to its users.
Additional permissions should be obtained from the applicable author or publisher of the image.
Full text @ Animals (Basel)