FIGURE

Figure 1

ID
ZDB-FIG-241019-9
Publication
Lu et al., 2024 - Analysis of Differential Gene Expression under Acute Lead or Mercury Exposure in Larval Zebrafish Using RNA-Seq
Other Figures
All Figure Page
Back to All Figure Page
Figure 1

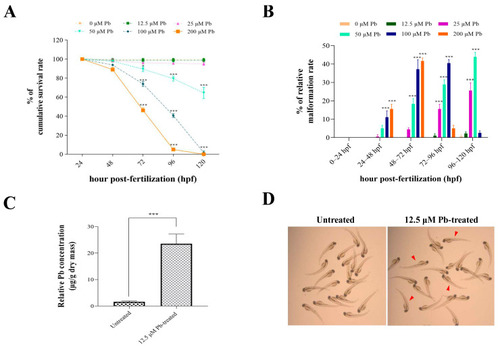
Physiological changes in developing zebrafish in response to acute lead exposure from 24 hpf to 120 hpf. (A) Survival rate of developing zebrafish after 96 h of exposure to nominal lead concentrations of 12.5 μM, 50 μM, 100 μM, and 200 μM, respectively. (B) Malformation rate of developing zebrafish after 96 h of exposure to lead. (C) Bioaccumulation in zebrafish larvae at 120 hpf after treatment with 12.5 μM lead; (D) Morphology of larval zebrafish at 120 hpf after treatment with 0 (control) and 12.5 μM lead for 96 h. Red arrowheads indicate representative normal larvae. Values represent the mean ± standard deviation of three biological replicates. * p < 0.05; *** p < 0.001.

Expression Data

Expression Detail
Antibody Labeling
Phenotype Data

Phenotype Detail
Acknowledgments
This image is the copyrighted work of the attributed author or publisher, and ZFIN has permission only to display this image to its users. Additional permissions should be obtained from the applicable author or publisher of the image. Full text @ Animals (Basel)