IMAGE

Figure 5

ID
ZDB-IMAGE-241019-43
Source
Figures for Lu et al., 2024
Image
Figure Caption

Figure 5

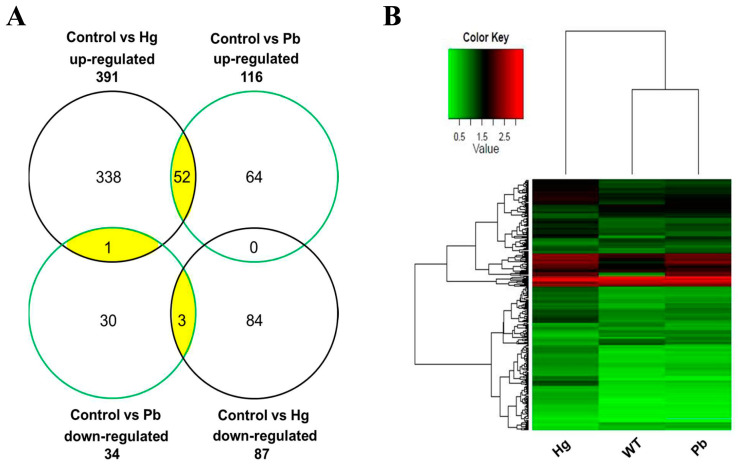
Gene expression profiling in larval zebrafish upon micromolar mercury and lead exposure. (A) Venn diagrams represent the number of up-regulated and down-regulated genes. Genes that change their expression in zebrafish larvae exposed to mercury are shown in a black circle. Genes that change their expression in zebrafish larvae exposed to lead are displayed in a green circle. Genes that are commonly regulated by mercury and lead are shown in a yellow oval. (B) Hierarchical clustering analysis based on gene expression profiles. Red shows up-regulated expression, while green represents down-regulated expression. Each column indicates different treatment groups, and each horizontal line refers to a gene. The color scale shows fold changes in gene expression.

Acknowledgments
This image is the copyrighted work of the attributed author or publisher, and ZFIN has permission only to display this image to its users. Additional permissions should be obtained from the applicable author or publisher of the image. Full text @ Animals (Basel)