
- Title
-
Ace Deficiency Induces Intestinal Inflammation in Zebrafish
- Authors
- Wei, M., Yu, Q., Li, E., Zhao, Y., Sun, C., Li, H., Liu, Z., Ji, G.
- Source
- Full text @ Int. J. Mol. Sci.
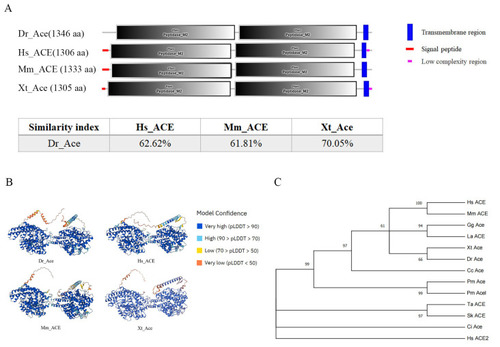
Homology comparison of Ace homologues in different species. ( |
Homology comparison of Ace homologues in different species. ( |
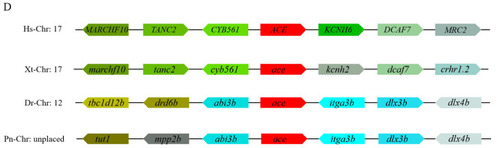
Expression patterns of |
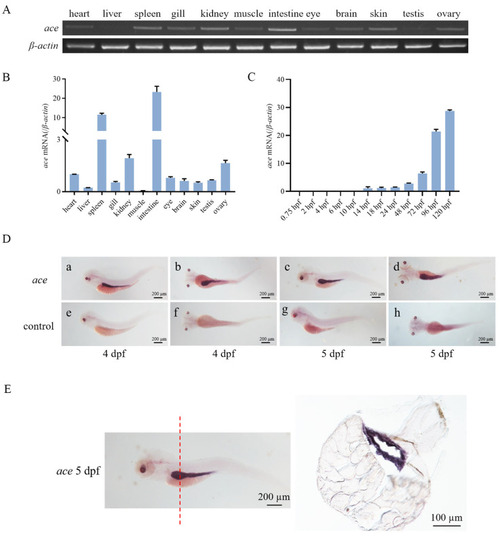
Subcellular localization of Ace in HEK293T cells. Recombinant plasmids |
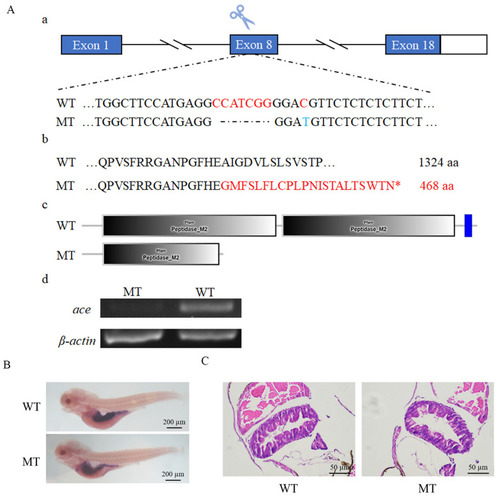
Knockout of ace and morphological examination of ace−/− mutant larvae. ( |
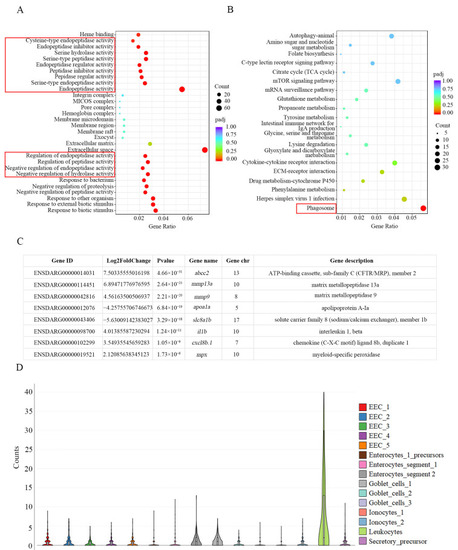
RNA-seq analysis of |
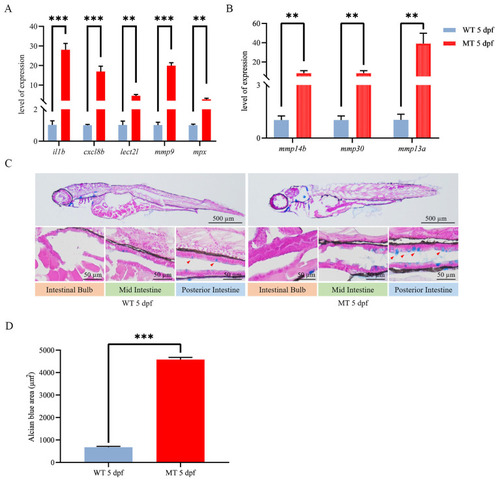
Inflammatory response evaluation for |
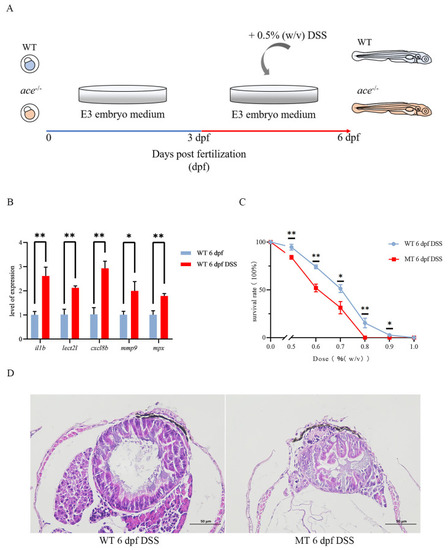
The IBD model was successfully constructed using DSS. ( |
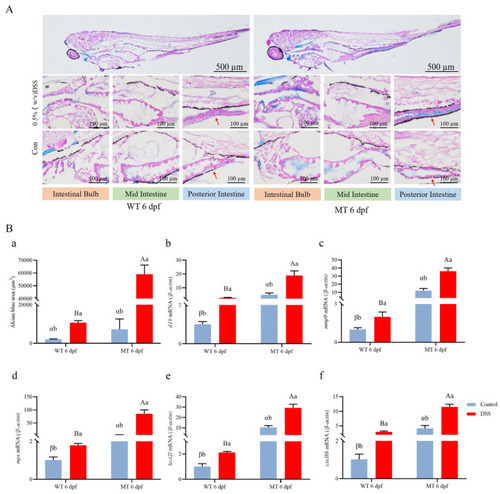
Histopathological assessment comparing |