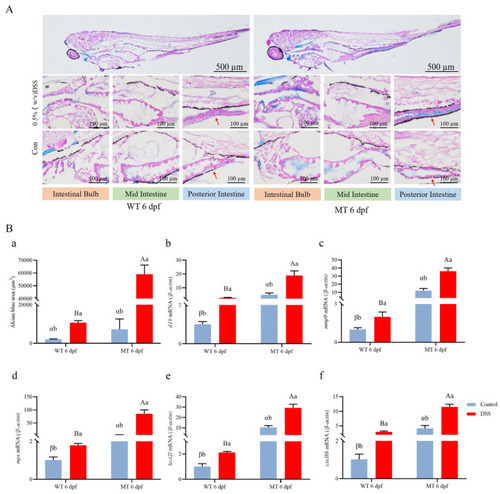
Histopathological assessment comparing ace−/− mutant and wild-type larvae treated with DSS. (A) AB-PAS staining sections highlighting mucus in the intestine of DSS-treated and untreated ace−/− mutants and wild-type larvae (upper panel). The lower panels show enlarged photographs of the intestinal bulb and the mid- and posterior intestine regions. At the bottom, the control group exhibits AB-PAS staining sections that did not undergo DSS treatment. The red arrow in the figure indicates the staining signal. (B) (a). Quantification of Alcian blue-stained cells in the digestive tract of ace−/− mutants and wild-type larvae at 6 dpf. Data represent the mean ± SD of 10 fish. (b–f). The expression of several pro-inflammatory factors in ace−/− mutants and wild-type larvae examined by qRT-PCR. Data are presented as the mean ± SD. Different lowercase letters indicate significant differences (p < 0.05) within the group; different uppercase letters indicate significant differences (p < 0.05) between the groups after DSS treatment; different Latin letters indicate significant differences (p < 0.05) between the groups before DSS treatment.
|
