|
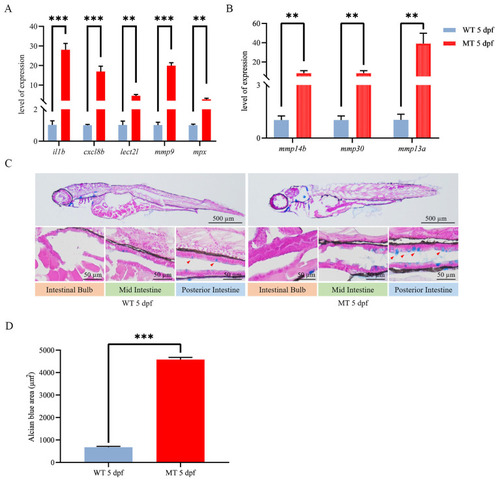
Inflammatory response evaluation for ace−/− mutants and wild-type larvae at 5 dpf. (A,B) qRT-PCR analysis of selected inflammation-related genes. (C) AB-PAS staining sections label mucus in the intestine of both ace−/− mutants and wild-type larvae at 5 dpf (upper panel). The lower panels provide enlarged photographs of the intestinal bulb and mid- and posterior intestine regions. The red arrowhead in the figure indicates the staining signal. (D) Cell statistics for Alcian blue staining in the digestive tract of ace−/− mutants and wild-type larvae at 5 dpf. Data are presented as the mean ± SD of 10 fish. ** p < 0.01, *** p < 0.001. The experiments were independently repeated three times.
|