
Figure 6
- ID
- ZDB-IMAGE-240620-207
- Genes
- Publication
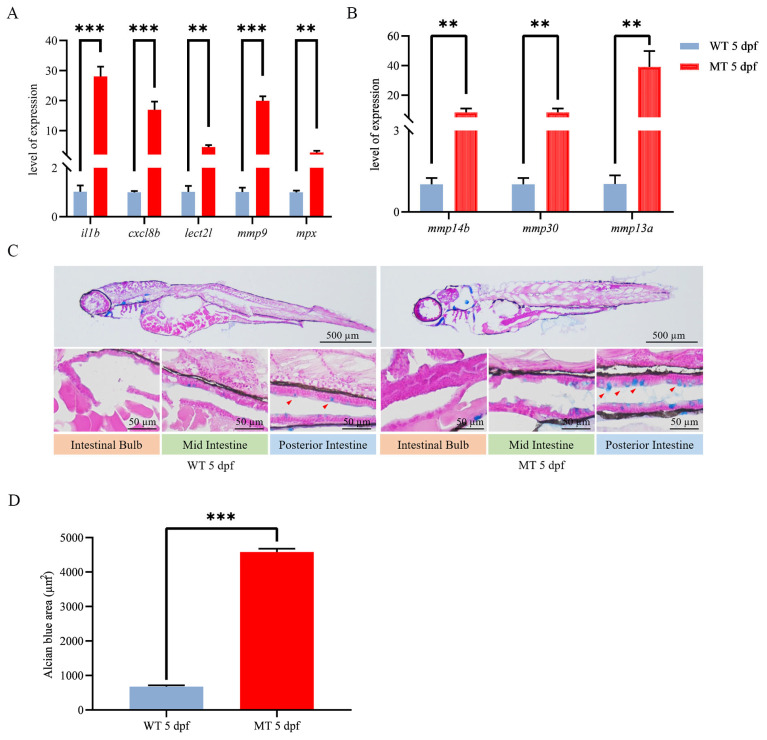
- Wei et al., 2024 - Ace Deficiency Induces Intestinal Inflammation in Zebrafish
- All Figures
- Figures for Wei et al., 2024
|
Figure 6
Inflammatory response evaluation for