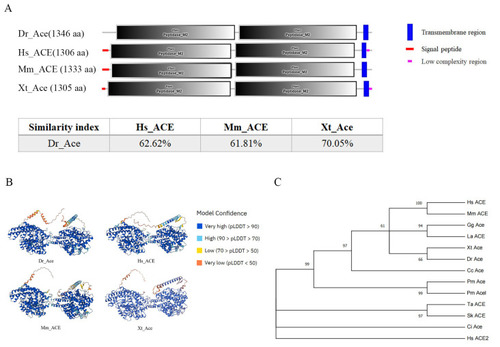
Homology comparison of Ace homologues in different species. (A) The secondary structures of Ace homologues in D. rerio, H. sapiens, M. musculus, and X. tropicalis. This diagram was generated using SMART online software (http://smart.embl-heidelberg.de/, accessed on 1 December 2023). Red squares, signal peptides; blue rectangles, transmembrane regions; M2, metallopeptidase 2 domain. The similarity index was derived by DNAMAN software (9.0.1.116). (B) The three-dimensional structures of D. rerio ACE, H. sapiens ACE, M. musculus ACE, and X. tropicalis ACE. This diagram was generated using the Alphafold online server (https://colab.research.google.com/github/deepmind/alphafold/blob/main/notebooks/AlphaFold.ipynb accessed on 5 December 2023). AlphaFold produces a per-residue model confidence score (pLDDT, predicted local distance difference test) between 0 and 100. Some regions below 50 pLDDT may be unstructured in isolation. (C) A phylogenetic tree of Ace homologues of various species was constructed with IQ-tree using the maximum likelihood method. Hs: H. sapiens (NP_000780), Mm: M. musculus (NP_997507), Gg: G. gallus (NP_001161204), La: L. agilis (XP_033024785), Xt: X. tropicalis (NP_001116882), Cc: C. carcharias (XP_041029546), Dr: D. rerio (XP_694336), Pn: P. nyererei (XP_005721704), Lo: L. oculatus (XP_015217378), Pm: P. marinus (XP_032821231, XP_032807619), Ci: C. intestinalis (XP_026693950), Sk: S. kowalevskii (XP_002741143), and Ta: T. adhaerens (XP_002111333). Each node was bootstrapped with 1000 replications to estimate its reliability. (D) Syntenic analysis among zebrafish ace genomic neighborhoods and those of humans, frogs, and flameback cichlids. Different colors indicate different genes. Orthologs of these genes in other species are shown in corresponding colors.
|
