
Figure 8
- ID
- ZDB-IMAGE-240620-209
- Genes
- Publication
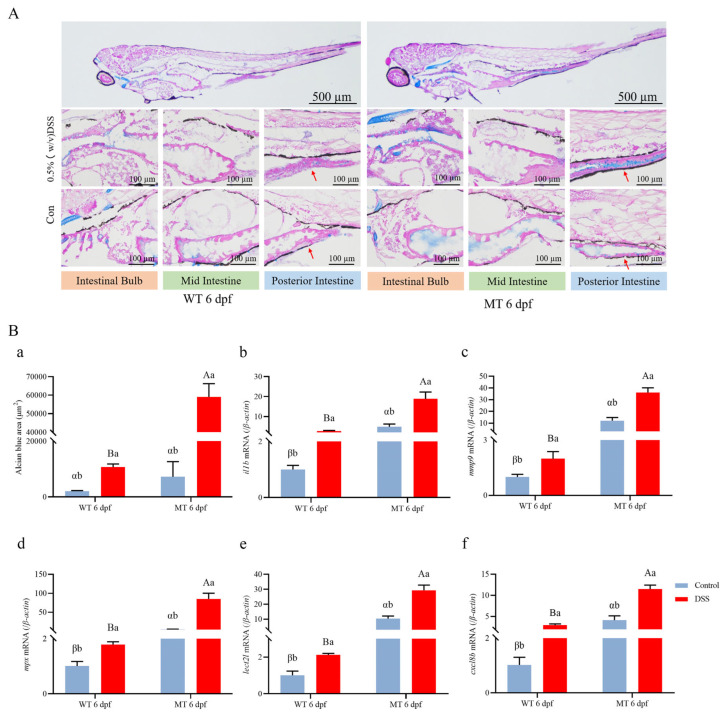
- Wei et al., 2024 - Ace Deficiency Induces Intestinal Inflammation in Zebrafish
- All Figures
- Figures for Wei et al., 2024
|
Figure 8
Histopathological assessment comparing