IMAGE

Figure 7

ID
ZDB-IMAGE-240620-208
Source
Figures for Wei et al., 2024
Image
Figure Caption

Figure 7

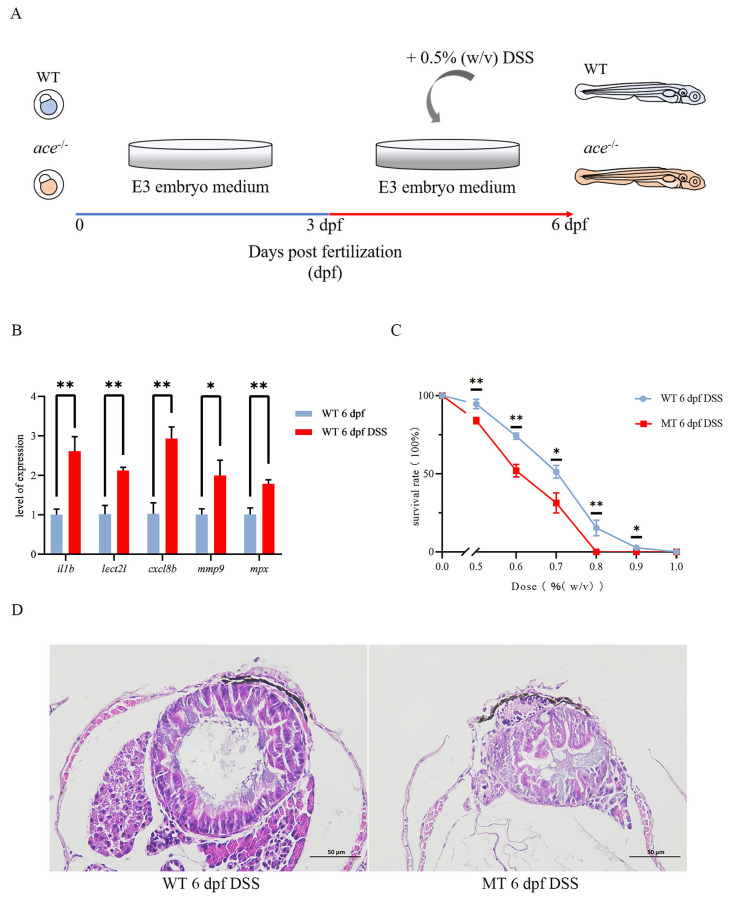
The IBD model was successfully constructed using DSS. (A) A diagram of IBD model development. (B) Changes in DSS-treated and untreated wild-type larvae were examined by qRT-PCR for several pro-inflammatory factors: ilb, lect2l, cxcl8b, mmp9, and mpx. Data represent the mean ± SD. * p < 0.05, ** p < 0.01. Three independent biological replicates were performed. (C) Line chart of survival rates comparing ace−/− mutants and wild-type larvae treated as the DSS dose (% (w/v)) increased from 0% to 1% (n = 50). The significance of differences is annotated above the nodes in the line chart. * p < 0.05, ** p < 0.01. (D) HE staining shows a more severely disorganized intestinal epithelium in ace−/− mutants compared with the wild type at 6 dpf following DSS treatment.

Acknowledgments
This image is the copyrighted work of the attributed author or publisher, and ZFIN has permission only to display this image to its users. Additional permissions should be obtained from the applicable author or publisher of the image. Full text @ Int. J. Mol. Sci.