|
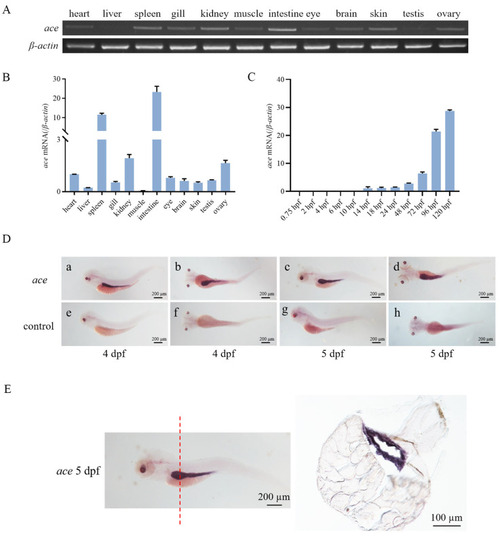
Expression patterns of ace mRNA in zebrafish. (A) Transcriptional expression patterns of ace mRNA in different tissues (heart, liver, spleen, gill, kidney, muscle, intestine, eye, brain, skin, testis, and ovary) were detected by RT-PCR. β-actin was used as an internal control. (B,C) Relative transcriptional expression of ace in different tissues and different developmental stages as measured by RT-qPCR. hpf: hours post-fertilization. β-actin was used as an internal control. (D) Spatio-temporal expression patterns of ace in embryos detected by WISH. “a–d” represents the results of anti-sense probe hybridization, while “e–h” represents the results of sense probe hybridization (negative control). dpf: days post-fertilization. (E) The intestinal region of the larvae at 5 dpf after WISH was frozen and sectioned (8 µm). The red line indicates the position of the frozen section.
|