FIGURE SUMMARY
Title

WRN loss accelerates abnormal adipocyte metabolism in Werner syndrome

Authors
Tian, Y., Lautrup, S., Law, P.W.N., Dinh, N.D., Fang, E.F., Chan, W.Y.
Source
Full text @ Cell Biosci.

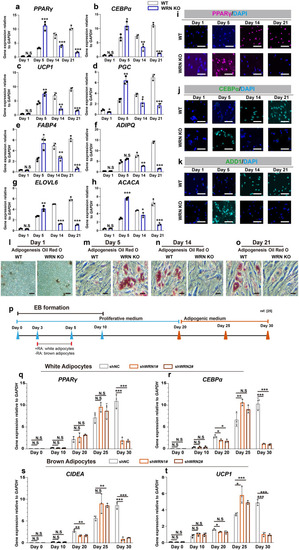
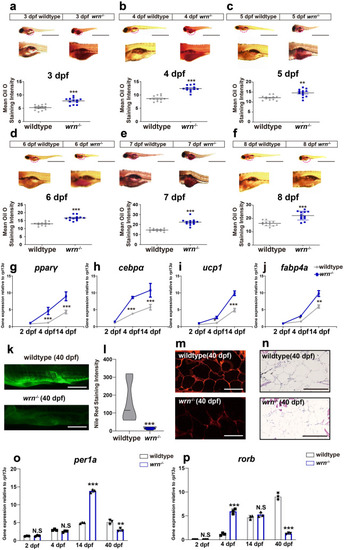
WRN deficiency accelerates adipocyte metabolism. ah qRT-PCR analysis of selected adipogenic markers PPARγ (a), CEBPα (b), UCP1 (c), PGC (d), FABP4 (e), ADIPQ (f), ELOVL6 (g), and ACACA (h) in hMSCs (N = 3 biological replicates). ik Representative immunofluorescent images of PPARγ (i), CEBPα (j), and ADD1 (k) (N = 3 biological replicates). Scale bar = 20 μm. lo Representative Oil Red O staining images during adipogenesis (N = 3 biological replicates). p Illustration of white and brown adipocytes differentiation following previous report [25]. q, r qRT-PCR analysis of selected white adipogenic markers PPARγ (q) and CEBPα (r) in hESCs (N = 3 biological replicates). s, t qRT-PCR analysis of selected brown adipogenic markers CIDEA (s), and UCP1 (t) in hESCs (N = 3 biological replicates). Data are presented as the mean ± S.D. Statistical analysis was performed using two-tailed unpaired Student’s t-test. *P < 0.05, **P < 0.01, ***P < 0.001

Late-stage adipogenic genes express earlier abnormally. a Illustration of the early stage and late stage during adipogenesis. be qRT-PCR analysis of early circadian genes PER1 (b), ANDPTL4 (c), ACAT2 (d), and CHST7 (e) in hMSCs (N = 3 biological replicates). fi qRT-PCR analysis of late circadian genes RORB (f), ME 1 (g), CYP1B1 (h), and LAMA 2 (i) in hMSCs (N = 3 biological replicates). j, k Representative immunostaining images of PER1 (j) and RORB (k). l, m qRT-PCR analysis of PER1 (l) and RORB (m) in hESCs-derived white adipocytes (N = 3 biological replicates). n, o qRT-PCR analysis of PER1 (l) and RORB (m) in hESCs-derived brown adipocytes (N = 3 biological replicates). Data are presented as the mean ± S.D. Statistical analysis was performed using two-tailed unpaired Student’s t-test. *P < 0.05, **P < 0.01, ***P < 0.001

The wrn−/− mutant zebrafish shows adipocyte prematurity. af Representative images of Oil Red O staining from 3 dpf to 8 dpf (N = 3 biological replicates). Scale bar = 100 μm. gj qRT-PCR analysis of selected adipogenic markers pparγ (g), cebpα (h), ucp1 (i), and fabp4 (j) at 2 dpf, 4 dpf, and 14 dpf (N = 3 biological replicates). k Representative images of Nile Red staining on 40 dpf (N = 3 biological replicates). Scale bar = 100 μm. l Violin graph of NileRed staining intensity analysis on 40 dpf (N = 3 biological replicates). m Representative images of Oil Red O staining sections (N = 3 biological replicates). Scale bar = 50 μm. n Representative images of Hematoxylin and Eosin (H&E) sections (N = 3 biological replicates). Scale bar = 50 μm. o, p qRT-PCR analysis of per1a (o) and rorb (p) (N = 3 biological replicates). Data are presented as the mean ± S.D. Statistical analysis was performed using two-tailed unpaired Student’s t-test. *P < 0.05, **P < 0.01, ***P < 0.001

EXPRESSION / LABELING:
Genes:
Fish:
Anatomical Term:
Stage Range: Long-pec to Days 30-44
PHENOTYPE:
Fish:
Observed In:
Stage Range: Protruding-mouth to Days 30-44

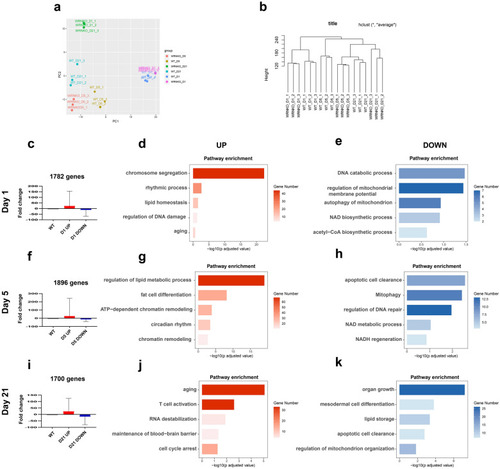
Stage-specific gene regulatory pattern during adipocyte differentiation. a Principal component (PCA) analysis of the different replica of the samples (N = 3 biological replicates). b Hierarchical clustering (HLC) of the different replica of the samples. c, f, i Fold change of the genes classified as UP and DOWN on day 1 (c), day 5 (f), and day 21 (i). d, g, j Representative Up-regulation KEGG enrichment pathways on day 1 (d), day 5 (g), and day 21 (j). e, h, k Representative down-regulation KEGG enrichment pathways on day 1 (e), day 5 (h), and day 21 (k)

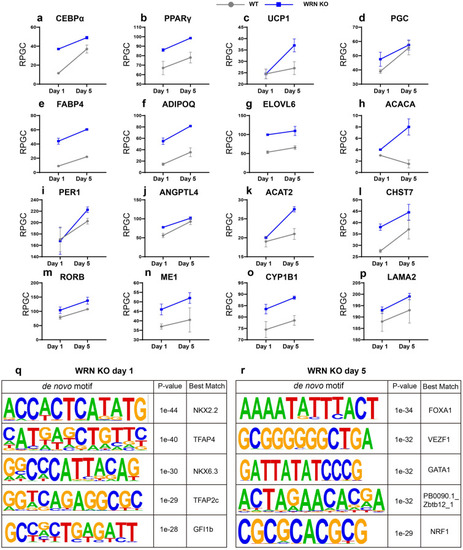
ATAC-seq profiling reflects adipocyte-related chromatin accessibility changes. ap Dynamic changes in chromatin accessibility of selected adipogenic associated genes of reads per genome coverage (RPGC) CEBPα (a), PPARγ (b), UCP1 (c), PGC (d), FABP4 (e), ADIPQ (f), ELVOL 6 (g), ACACA (h), PER 1 (i), ANDPTL 4 (j), ACAT 2 (k), CHST 7 (l), RORB (m), ME 1 (n), CYP1B1 (o) and LAMA 2 (p). q, r De novo motif analysis of WRN KO adipocytes on days 1 and 5

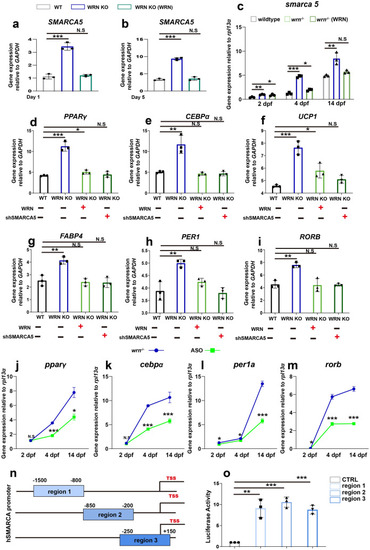
Hyperactive SMARCA5 causes the adipocyte prematurity in WS. a, b qRT-PCR analysis of SMARCA5 expression on days 1 (a) and 5 (b) among WT, WRN KO, and WRN overexpression adipocytes (WRN KO (WRN)) (N = 3 biological replicates). b qRT-PCR analysis of smarca5 expression at 2 dpf, 4 dpf, and 14 dpf among wildtype, wrn−/− mutant zebrafish, and wrn overexpression zebrafish (wrn−/− (WRN)) (N = 3 biological replicates). dg qRT-PCR analysis of PPARγ, CEBPα, UCP1, and FABP4 on day 5 among WT, WRN KO, and WRN overexpression or SMARCA5 knock-down adipocytes. (N = 3 biological replicates). h, i qRT-PCR analysis of PER1 and RORB on day 5 among WT, WRN KO, and WRN overexpression or SMARCA5 knock-down adipocytes. (N = 3 biological replicates). j, k qRT-PCR analysis of pparγ and cebpα at 2 dpf, 4 dpf, and 14 dpf between wrn−/− mutant zebrafish and ASOs treated zebrafish (N = 3 biological replicates). l, m qRT-PCR analysis of per1a and rorb at 2 dpf, 4 dpf, and 14 dpf between wrn−/− mutant zebrafish and ASOs treated zebrafish (N = 3 biological replicates). n Illustration of three different regions in human SMARCA5 promoters selected for dual-luciferase assay. o Dual-luciferase assay analysis of SMARCA5 transcription activity (N = 3 biological replicates). Data are presented as the mean ± S.D. Statistical analysis was performed using two-tailed unpaired Student’s t-test. *P < 0.05, **P < 0.01, ***P < 0.001

EXPRESSION / LABELING:
Genes:
Fish:
Anatomical Term:
Stage Range: Long-pec to Days 14-20

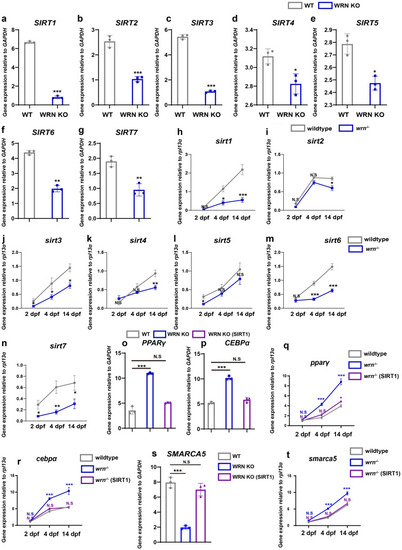
SIRT1 regulates SMARCA5 expression during adipogenesis in hMSCs and zebrafish models. ag qRT-PCR analysis of SIRT family (SIRT1-7) on day 5 during adipogenesis (N = 3 biological replicates). hn qRT-PCR analysis of sirt1-7 at 2 dpf, 4 dpf, and 14 dpf in zebrafish (N = 3 biological replicates). o, p qRT-PCR analysis of PPARγ (o) and CEBPα (p) among WT, WRN KO, and WRN KO (SIRT1) on day 5 during adipogenesis (N = 3 biological replicates). q, r qRT-PCR analysis of pparγ (q) and cebpα (r) among wildtype, wrn−/− mutant zebrafish, wrn−/− mutant zebrafish (SIRT1) (N = 3 biological replicates). s qRT-PCR analysis of SMARCA5 among WT, WRN KO, and WRN KO (SIRT1) on day 5 during adipogenesis (N = 3 biological replicates). t qRT-PCR analysis of smarca5 among wildtype, wrn−/− mutant zebrafish, wrn−/− mutant zebrafish (SIRT1) (N = 3 biological replicates). Data are presented as the mean ± S.D. Statistical analysis was performed using two-tailed unpaired Student’s t-test. *P < 0.05, **P < 0.01, ***P < 0.001

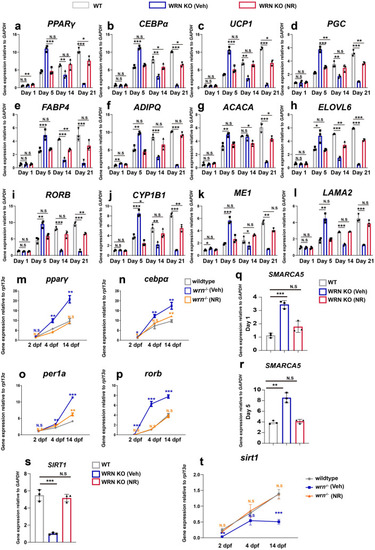
Nicotinamide riboside (NR) normalizes metabolism in WRN KO adipocytes. ah qTR-PCR analysis of selected adipogenic genes PPARγ (a), CEBPα (b), UCP1 (c), PGC (d), FABP4 (e), ADIPQ (f), ACACA (g), and ELOVL 6 (h) among WT, WRN KO (veh), and WRN KO (NR) in hMSCs (N = 3 biological replicates). il qTR-PCR analysis of selected adipogenic circadian genes RORB (i), CYP1B1 (j), ME1 (k), and LAMA2 (l) among WT, WRN KO (veh), and WRN KO (NR) (N = 3 biological replicates). mp qTR-PCR analysis of selected adipogenic circadian genes pparγ (m), cebpα (n), per1a (o), and rorb (p) among wildtype, wrn−/− mutant zebrafish (veh), and wrn−/− mutant zebrafish (NR) (N = 3 biological replicates). q, r qTR-PCR analysis of SMARCA5 on day 1 (q) and day 5 (r) during adipogenesis (N = 3 biological replicates). s qTR-PCR analysis of SIRT1 on day 5 during adipogenesis (N = 3 biological replicates). t qTR-PCR analysis of sirt1 at 2 dpf, 4 dpf, and 14 dpf in zebrafish (N = 3 biological replicates). Data are presented as the mean ± S.D. Statistical analysis was performed using two-tailed unpaired Student’s t-test. *P < 0.05, **P < 0.01, ***P < 0.001

Acknowledgments
This image is the copyrighted work of the attributed author or publisher, and ZFIN has permission only to display this image to its users. Additional permissions should be obtained from the applicable author or publisher of the image. Full text @ Cell Biosci.