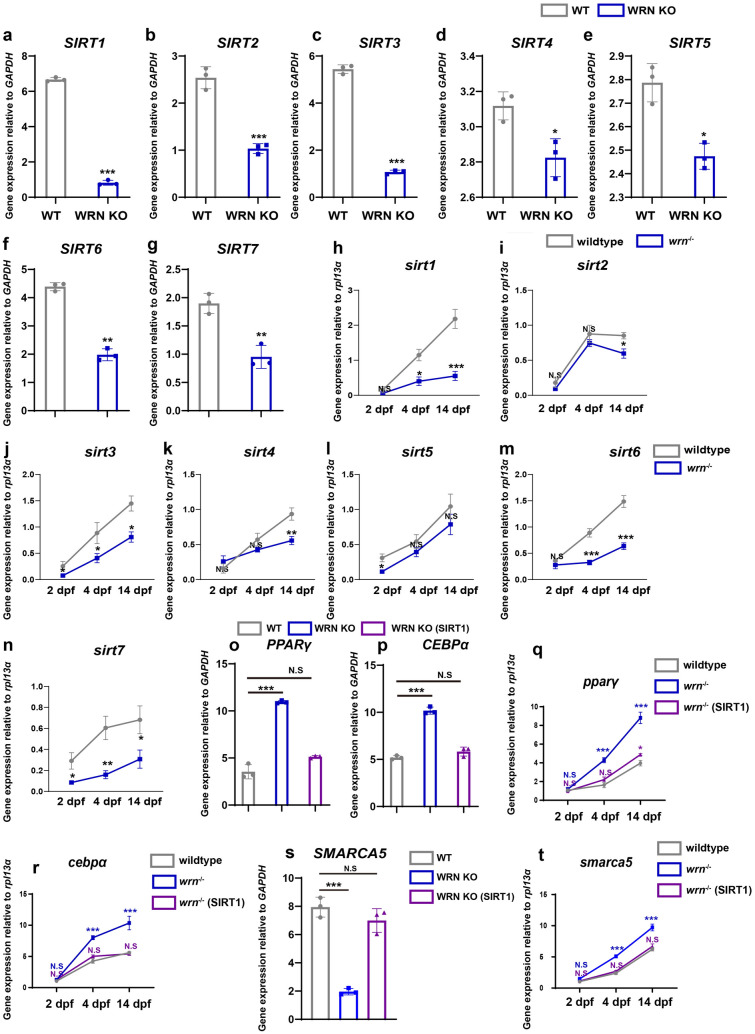
Image
Figure Caption

Fig. 7

SIRT1 regulates SMARCA5 expression during adipogenesis in hMSCs and zebrafish models. ag qRT-PCR analysis of SIRT family (SIRT1-7) on day 5 during adipogenesis (N = 3 biological replicates). hn qRT-PCR analysis of sirt1-7 at 2 dpf, 4 dpf, and 14 dpf in zebrafish (N = 3 biological replicates). o, p qRT-PCR analysis of PPARγ (o) and CEBPα (p) among WT, WRN KO, and WRN KO (SIRT1) on day 5 during adipogenesis (N = 3 biological replicates). q, r qRT-PCR analysis of pparγ (q) and cebpα (r) among wildtype, wrn−/− mutant zebrafish, wrn−/− mutant zebrafish (SIRT1) (N = 3 biological replicates). s qRT-PCR analysis of SMARCA5 among WT, WRN KO, and WRN KO (SIRT1) on day 5 during adipogenesis (N = 3 biological replicates). t qRT-PCR analysis of smarca5 among wildtype, wrn−/− mutant zebrafish, wrn−/− mutant zebrafish (SIRT1) (N = 3 biological replicates). Data are presented as the mean ± S.D. Statistical analysis was performed using two-tailed unpaired Student’s t-test. *P < 0.05, **P < 0.01, ***P < 0.001

Figure Data
Acknowledgments
This image is the copyrighted work of the attributed author or publisher, and ZFIN has permission only to display this image to its users. Additional permissions should be obtained from the applicable author or publisher of the image. Full text @ Cell Biosci.