FIGURE

Fig. 1

ID
ZDB-FIG-240109-49
Publication
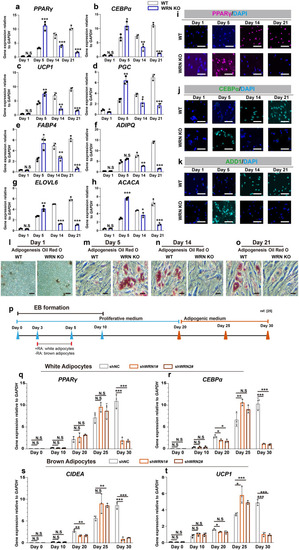
Tian et al., 2024 - WRN loss accelerates abnormal adipocyte metabolism in Werner syndrome
Other Figures
All Figure Page
Back to All Figure Page
Fig. 1

WRN deficiency accelerates adipocyte metabolism. ah qRT-PCR analysis of selected adipogenic markers PPARγ (a), CEBPα (b), UCP1 (c), PGC (d), FABP4 (e), ADIPQ (f), ELOVL6 (g), and ACACA (h) in hMSCs (N = 3 biological replicates). ik Representative immunofluorescent images of PPARγ (i), CEBPα (j), and ADD1 (k) (N = 3 biological replicates). Scale bar = 20 μm. lo Representative Oil Red O staining images during adipogenesis (N = 3 biological replicates). p Illustration of white and brown adipocytes differentiation following previous report [25]. q, r qRT-PCR analysis of selected white adipogenic markers PPARγ (q) and CEBPα (r) in hESCs (N = 3 biological replicates). s, t qRT-PCR analysis of selected brown adipogenic markers CIDEA (s), and UCP1 (t) in hESCs (N = 3 biological replicates). Data are presented as the mean ± S.D. Statistical analysis was performed using two-tailed unpaired Student’s t-test. *P < 0.05, **P < 0.01, ***P < 0.001

Expression Data

Expression Detail
Antibody Labeling
Phenotype Data

Phenotype Detail
Acknowledgments
This image is the copyrighted work of the attributed author or publisher, and ZFIN has permission only to display this image to its users. Additional permissions should be obtained from the applicable author or publisher of the image. Full text @ Cell Biosci.