
- Title
-
Chronodisruption and Loss of Melatonin Rhythm, Associated with Alterations in Daily Motor Activity and Mitochondrial Dynamics in Parkinsonian Zebrafish, Are Corrected by Melatonin Treatment
- Authors
- Aranda-Martínez, P., Fernández-Martínez, J., Ramírez-Casas, Y., Rodríguez-Santana, C., Rusanova, I., Escames, G., Acuña-Castroviejo, D.
- Source
- Full text @ Antioxidants (Basel)
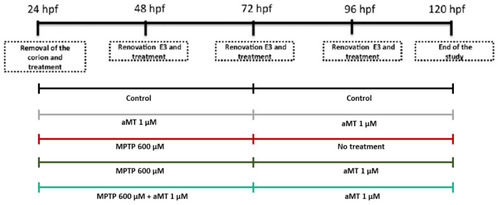
Schedule of the experimental conditions. |
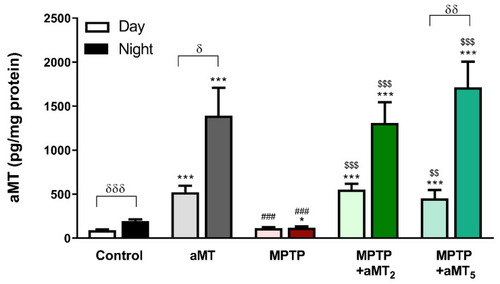
Endogenous levels of melatonin in zebrafish embryos during the day (light color) and during the night (dark color). Control, untreated embryos; aMT, control embryos treated with 1 μM melatonin; MPTP, embryos incubated with 600 μM MPTP; MPTP+MT2, embryos treated with 600 μM MPTP from 24 hpf to 72 hpf plus 1 μM melatonin from 72 hpf to 120 hpf; MPTP+aMT5, embryos treated with 600 μM MPTP from 24 hpf to 72 hpf plus 1 μM from 24 hpf to 120 hpf. Data are presented as mean ± SEM. * p < 0.05 vs. control; *** p < 0.001 vs. control, ### p < 0.001 vs. aMT; $$ p < 0.01 vs. MPTP; $$$ p < 0.001 vs. MPTP; δ p < 0.05 vs. day; δδ p < 0.01 vs. day; δδδ p < 0.001 vs. day. Unpaired t test. PHENOTYPE:
|
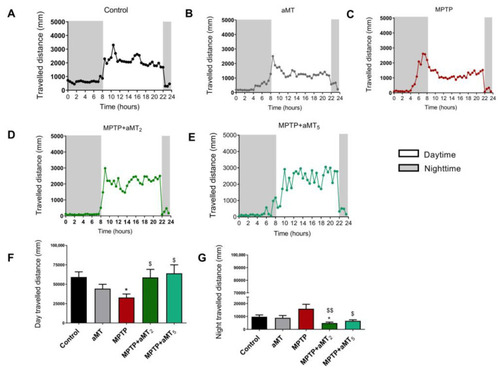
Total distance traveled during 24 h by zebrafish embryos. The light and dark conditions (shaded part) are 14:10 h, respectively. (A) control rhythm; (B) aMT group; (C) MPTP group; (D) MPTP+aMT2 group; (E) MPTP+aMT5 group; (F) total day travelled distance; and (G) total night travelled distance. Data are presented as mean ± SEM. * p < 0.05 vs. control; $ p < 0.05 vs. MPTP; $$ p < 0.01 vs. MPTP. Unpaired t test. PHENOTYPE:
|
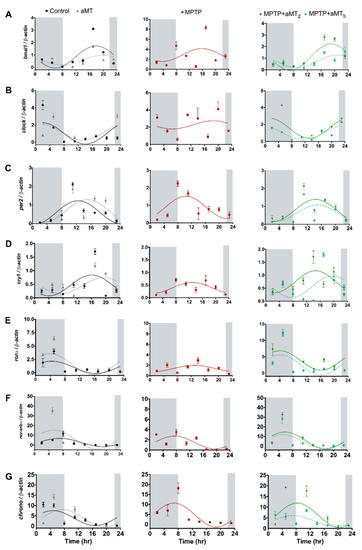
Relative expression of the clock genes: (A) bmal1, (B) clock, (C) per2, (D) cry1, (E) rorα, (F) reverbα, and (G) chrono in control, aMT, MPTP, and MPTP+aMT treatments of zebrafish embryos. Data are expressed as means ± SEM. Measured in light and dark conditions (shaded part). |
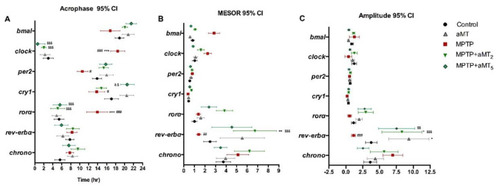
Graphical presentation of the cosinor parameters of the genes analyzed. (A) The acrophase, (B) Mesor, and (C) Amplitude chart of clock genes bmal1, clock, per2, cry1, rorα, rev-erbα, and chrono. Data are expressed as mean ± SEM. * p < 0.05 vs. control; ** p < 0.01 vs. control; *** p < 0.001 vs. control; # p < 0.05 vs. aMT; ## p < 0.01 vs. aMT; ### p < 0.001 vs. aMT; $ p < 0.05 vs. MPTP; $$ p < 0.01 vs. MPTP; $$$ p < 0.001 vs. MPTP; & p < 0.05 vs. MPTP+aMT2. Two-way ANOVA with a Tukey’s post hoc test. |
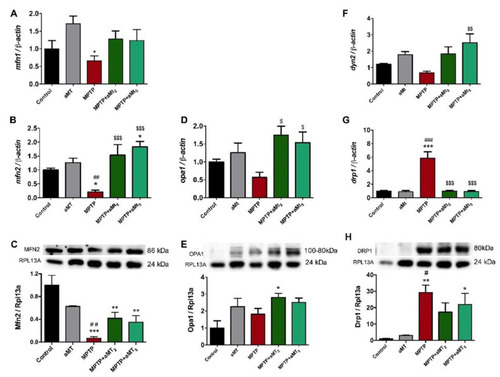
Analysis of the genes and proteins involved in mitochondrial dynamics. Regarding fission, the following markers were analyzed: (A) Expression of mfn1 mRNA; (B) Expression of mfn2 mRNA and (C) levels of Mfn2 protein in the same experimental groups; (D) Expression of opa1 mRNA and (E) levels of Opa1 protein in the same experimental groups. Fusion markers analyzed were: (F) dyn2 mRNA expression; (G) drp1 mRNA expression; and (H) Drp1 protein levels in the same experimental groups. Data are presented as mean ± SEM. * p < 0.05 versus control; ** p < 0.01 vs. control; *** p < 0.001 vs. control; # p < 0.05 vs. aMT; ## p < 0.01 vs. aMT; ### p < 0.001 vs. aMT; $ p < 0.05; $$ p < 0.01 vs. MPTP; $$$ p < 0.001 vs. MPTP. One-way ANOVA with a Tukey’s post hoc test. |
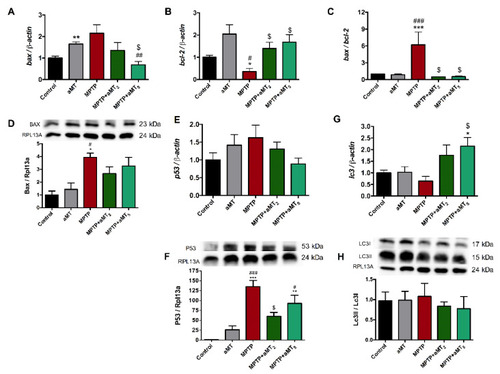
Analysis of apoptotic and autophagy pathways. (A) bax and (B) bcl-2 mRNA expression in the studied groups, and the bax/bcl-2 ratio (C). (D) protein levels of Bax. (E) p53 mRNA expression and (F) P53 protein levels. (G) mRNA expression of lc3 and (H) protein ratio of Lc3II/Lc3I. Data are presented as mean ± SEM. * p < 0.05 vs. control; ** p < 0.01 vs. control; *** p < 0.001 vs. control; # p < 0.05 vs. aMT; ## p < 0.01 vs. aMT; ### p < 0.001 vs. aMT; $ p < 0.05 vs. MPTP. Unpaired t test and One-way ANOVA with a Tukey’s post hoc test. |