
Image
|
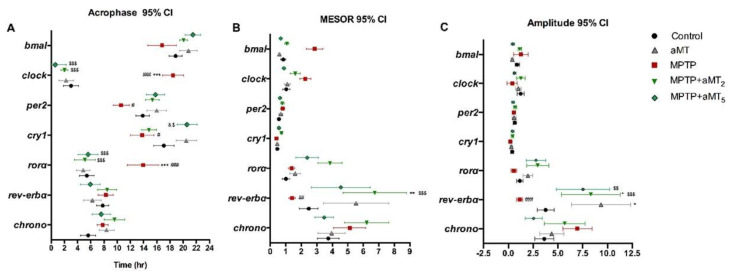
Figure Caption
Figure 5
Graphical presentation of the cosinor parameters of the genes analyzed. (A) The acrophase, (B) Mesor, and (C) Amplitude chart of clock genes bmal1, clock, per2, cry1, rorα, rev-erbα, and chrono. Data are expressed as mean ± SEM. * p < 0.05 vs. control; ** p < 0.01 vs. control; *** p < 0.001 vs. control; # p < 0.05 vs. aMT; ## p < 0.01 vs. aMT; ### p < 0.001 vs. aMT; $ p < 0.05 vs. MPTP; $$ p < 0.01 vs. MPTP; $$$ p < 0.001 vs. MPTP; & p < 0.05 vs. MPTP+aMT2. Two-way ANOVA with a Tukey’s post hoc test.
Acknowledgments
This image is the copyrighted work of the attributed author or publisher, and
ZFIN has permission only to display this image to its users.
Additional permissions should be obtained from the applicable author or publisher of the image.
Full text @ Antioxidants (Basel)