
IMAGE
Figure 4
Image
|
Figure Caption
Figure 4
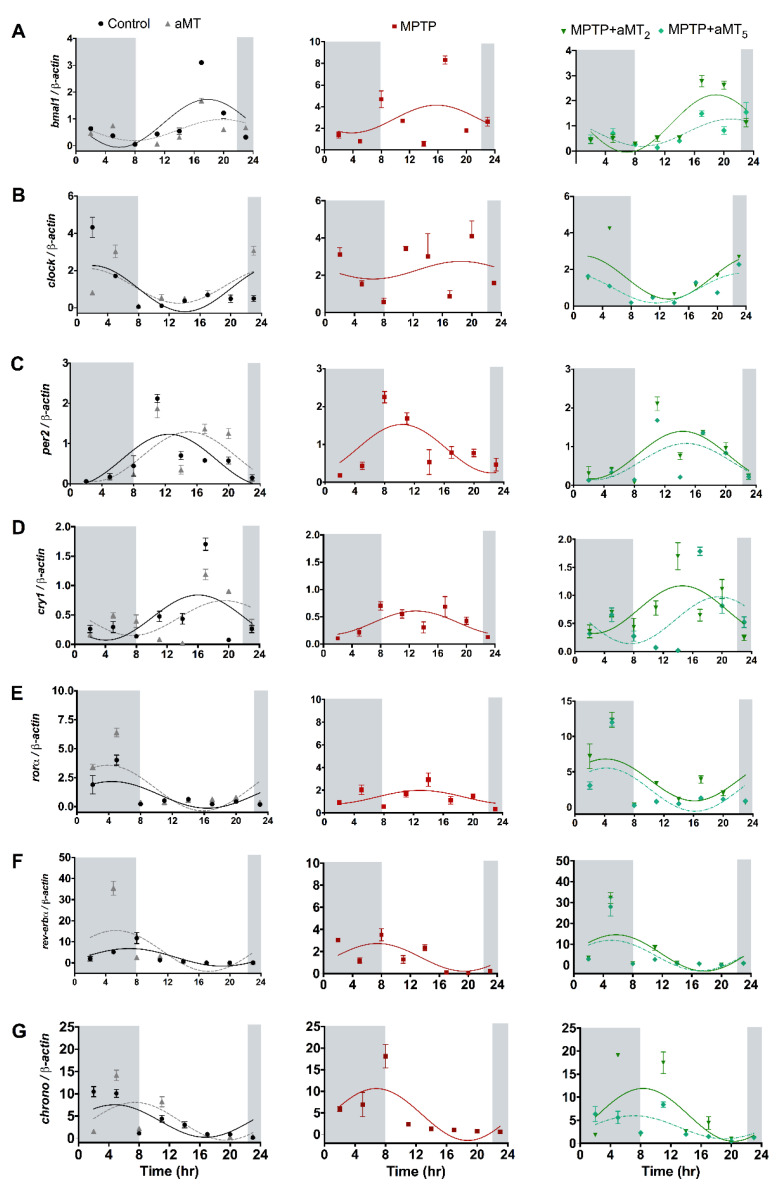
Relative expression of the clock genes: (A) bmal1, (B) clock, (C) per2, (D) cry1, (E) rorα, (F) reverbα, and (G) chrono in control, aMT, MPTP, and MPTP+aMT treatments of zebrafish embryos. Data are expressed as means ± SEM. Measured in light and dark conditions (shaded part).
Figure Data
Acknowledgments
This image is the copyrighted work of the attributed author or publisher, and
ZFIN has permission only to display this image to its users.
Additional permissions should be obtained from the applicable author or publisher of the image.
Full text @ Antioxidants (Basel)