
Figure 6
|
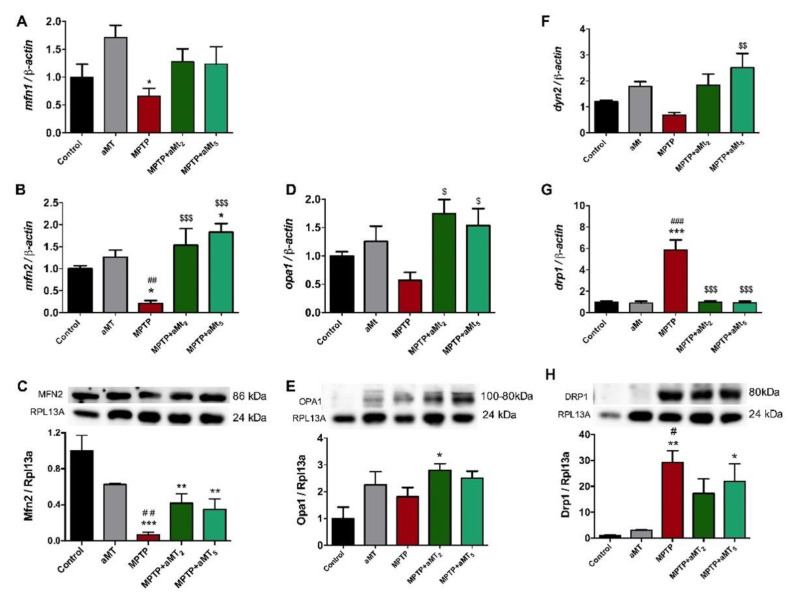
Figure 6
Analysis of the genes and proteins involved in mitochondrial dynamics. Regarding fission, the following markers were analyzed: (A) Expression of mfn1 mRNA; (B) Expression of mfn2 mRNA and (C) levels of Mfn2 protein in the same experimental groups; (D) Expression of opa1 mRNA and (E) levels of Opa1 protein in the same experimental groups. Fusion markers analyzed were: (F) dyn2 mRNA expression; (G) drp1 mRNA expression; and (H) Drp1 protein levels in the same experimental groups. Data are presented as mean ± SEM. * p < 0.05 versus control; ** p < 0.01 vs. control; *** p < 0.001 vs. control; # p < 0.05 vs. aMT; ## p < 0.01 vs. aMT; ### p < 0.001 vs. aMT; $ p < 0.05; $$ p < 0.01 vs. MPTP; $$$ p < 0.001 vs. MPTP. One-way ANOVA with a Tukey’s post hoc test.