
|
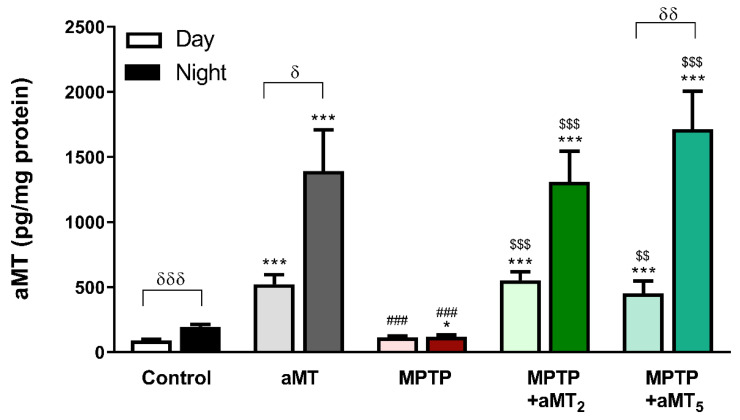
Figure 2
Endogenous levels of melatonin in zebrafish embryos during the day (light color) and during the night (dark color). Control, untreated embryos; aMT, control embryos treated with 1 μM melatonin; MPTP, embryos incubated with 600 μM MPTP; MPTP+MT2, embryos treated with 600 μM MPTP from 24 hpf to 72 hpf plus 1 μM melatonin from 72 hpf to 120 hpf; MPTP+aMT5, embryos treated with 600 μM MPTP from 24 hpf to 72 hpf plus 1 μM from 24 hpf to 120 hpf. Data are presented as mean ± SEM. * p < 0.05 vs. control; *** p < 0.001 vs. control, ### p < 0.001 vs. aMT; $$ p < 0.01 vs. MPTP; $$$ p < 0.001 vs. MPTP; δ p < 0.05 vs. day; δδ p < 0.01 vs. day; δδδ p < 0.001 vs. day. Unpaired t test.