
Image
|
Figure Caption
Figure 7
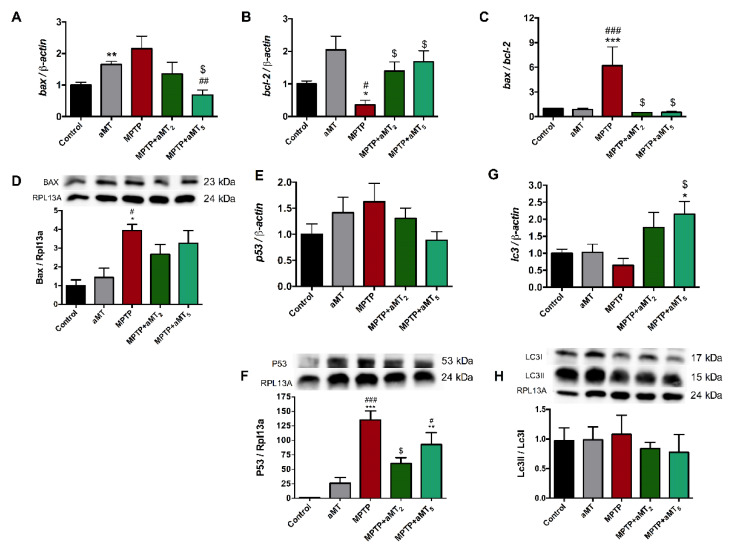
Analysis of apoptotic and autophagy pathways. (A) bax and (B) bcl-2 mRNA expression in the studied groups, and the bax/bcl-2 ratio (C). (D) protein levels of Bax. (E) p53 mRNA expression and (F) P53 protein levels. (G) mRNA expression of lc3 and (H) protein ratio of Lc3II/Lc3I. Data are presented as mean ± SEM. * p < 0.05 vs. control; ** p < 0.01 vs. control; *** p < 0.001 vs. control; # p < 0.05 vs. aMT; ## p < 0.01 vs. aMT; ### p < 0.001 vs. aMT; $ p < 0.05 vs. MPTP. Unpaired t test and One-way ANOVA with a Tukey’s post hoc test.
Figure Data
Acknowledgments
This image is the copyrighted work of the attributed author or publisher, and
ZFIN has permission only to display this image to its users.
Additional permissions should be obtained from the applicable author or publisher of the image.
Full text @ Antioxidants (Basel)