FIGURE SUMMARY
Title

In-frame deletion of SMC5 related with the phenotype of primordial dwarfism, chromosomal instability and insulin resistance

Authors
Zhu, W., Shi, Y., Zhang, C., Peng, Y., Wan, Y., Xu, Y., Liu, X., Han, B., Zhao, S., Kuang, Y., Song, H., Qiao, J.
Source
Full text @ Clin Transl Med

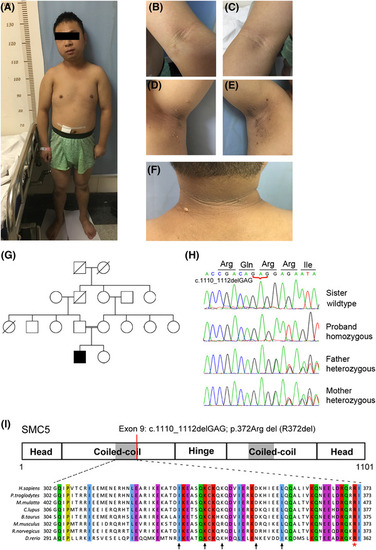
Identification of homozygous SMC5 in‐frame deletion in the patient with primordial dwarfism and severe insulin resistance. (A–F) Clinical features in the patient included proportionate short stature (A) and severe acanthosis nigricans in the antecubital fossae (B and C), axillae (D and E) and back of the neck (F), along with skin tags. (G) Pedigree diagram of the consanguineous family. (H) Representative Sanger sequencing of the nonsense allele in the sister, the heterozygous allele in parents and the homozygous allele in patients. (I) Position of the p.Arg372del variant located in the binding domain of SMC5 (grey, p. 302–373) with the NSMCE2 protein. A multispecies alignment is shown to highlight the strong conservation of the deleted amino acid, p.Arg372 (red asterisk). Black arrows indicate SMC5 residues important for binding with NSMCE2, as described.29

Replication stress exacerbates genome instability in patient's cells. (A) A representative western blot cropped to show unaffected NSMCE2–SMC5–SMC6 subcomplex expression in patient fibroblasts. (B) Interaction between NSMCE2 (N‐terminal HIS) or SMC6 (N‐terminal MYC) and SMC5 (N‐terminal FLAG‐tagged wild‐type (WT) or R372DEL), as determined by immunoprecipitation after transfection in HEK293T cells. Proteins were immunopurified using anti‐FLAG beads. Data are presented as mean ± s.e.m. and n = 5 biological replicates for quantification on the right panel. (C) HU recovery assay. Fibroblasts were incubated with mock or 250‐μM HU for 18 h, labelled with EdU for 30 min, pre‐extracted, fixed and costained for EdU and DAPI. The EdU‐positive cells were quantified. (D) Quantification of cell cycle phases in mock‐ or HU‐treated fibroblasts. n = 2 biological replicates were performed per condition per genotype. (E) Representative image of chromatid gaps or breaks from chromosomal aberration analysis in primary lymphocytes derived from the patient. Black arrows denote acentric fragments. Scale bar, 30 μm. (F and G) Exposure of cells to HU exacerbates micronucleus (F) and nucleoplasmic bridge (G) formation. Fibroblasts were exposed to 1‐mM HU for 4 h, followed by 24‐h recovery in the presence of 3‐μg/ml cytochalasin B, and assessed using fluorescence microscopy. In parts (C, D, F and G), data are presented as the mean ± s.d. *p < .05, **p < .01, ***p < .001 by Student's t‐test

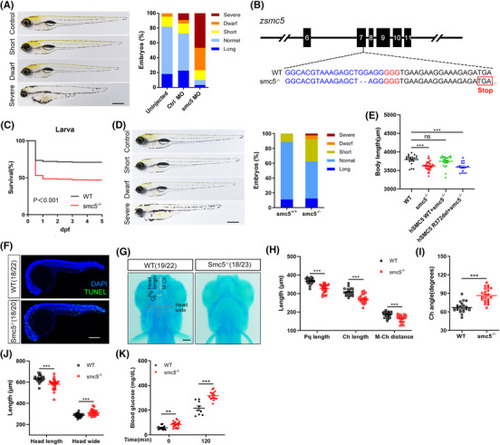
Smc5 deficiency in zebrafish led to short length, increased mortality and impaired glucose homeostasis. (A) Phenotypes and quantification of length in smc5 morpholino (MO)‐injected zebrafish. Representative images of defined length categories: long, >1 SD; normal, −1 to 1 SD; short, −1 to −2 SD; dwarf, −2 to −3 SD; severe, <−3 SD (left); and quantification of different categories (right). Uninjected, n = 22; control MO, n = 22; smc5 MO, n = 30. Scale bar = 500 μm. (B) CRISPR target site in exon 7 of zebrafish smc5 (zsmc5) gene, resulting in 2‐bp deletion allele and premature stop codons (red box). The CRISPR‐guided RNA sequence and the protospacer adjacent motif (PAM) are highlighted in blue and red, respectively. (C) Survival curve over time from wild‐type (WT) and smc5−/− larvae. n = 950 and 962 for WT, smc5−/− larvae, respectively; p < .001. Log‐rank Mantel–Cox test. (D) Phenotypes and quantification of length in smc5 knockout (KO) zebrafish recorded as in (A). Smc5+/+, n = 36; smc5−/−, n = 40. Scale bar = 500 μm. (E) Coinjection of human SMC5 tol2 plasmid (WT or R372del) with transposase mRNA and body length was scored at 5 dpf. WT, n = 21; smc5−/−, n = 34; hSMC5 WT+smc5−/−, n = 24; hSMC5 R372del+smc5−/−, n = 17. (F) TUNEL staining showed numerous apoptotic cells in the brain and posterior segment of spinal cord in smc5−/− embryos at 24 hpf. Scale bar = 250 μm. (G) Representative ventral images of Alcian blue staining of cartilage structures show severe defects in smc5−/− larvae at 5 dpf. Pq, palatoquadrate; Ch, ceratohyal arch; M–Ch, distance from Meckel's cartilage (M) to Ch; the yellow curve indicates Ch angle. WT, n = 22; smc5−/−, n = 23. Scale bars = 100 μm. (H–J) Quantitative analysis of a series of changes of phenotypic indexes, including Pq, Ch and M–Ch length (H), Ch angle (I) and head length and wide (J) in G. (K) The glucose tolerance test in 3‐month‐old WT and smc5−/− zebrafish. Blood glucose was measured at 0 (WT, n = 12; smc5−/−, n = 21) and 120 min (WT, n = 9; smc5−/−, n = 15) after glucose injection. Values represent the mean ± s.e.m. **p < .01, ***p < .001 by Student's t‐test

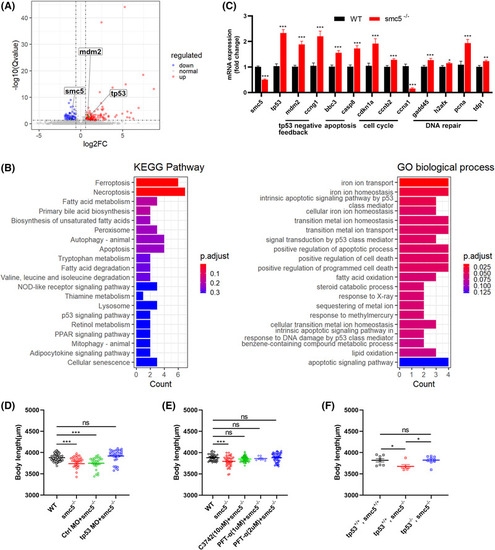
Smc5 deficiency activates tp53‐related apoptosis pathway in zebrafish. (A) Volcano plot showing common differentially expressed genes (DEGs) of HOM and wild‐type (WT) 3‐dpf embryos. The horizontal line indicates a log10 (adjusted p value) of 1.3 (Qvalue of .05); and the vertical lines a log2 fold change of −.58 and .58. (B) Top 20 enriched KEGG pathway and gene ontology (GO) biological process (ranked by p.adjust) from DEGs as in (A) using the ClusterProfiler R package. (C) The expression of genes involved in the DNA damage response and signal transduction by tp53 detected in 3‐dpf larvae by quantitative real‐time PCR (qPCR). Actin was chosen as the internal reference gene. (D) Knockdown of tp53 partially rescued the short phenotype in smc5−/− larvae. WT, n = 77; smc5−/−, n = 36; smc5−/− + Ctrl morpholino (MO), n = 26; smc5−/− + tp53 MO, n = 31; (E) body length of smc5−/− embryos at 5‐dpf treated with 10‐μM C3742 from 3.5 to 4.5 dpf or indicated concentration of PFT‐α from 24 hpf to 5 dpf. WT, n = 38; smc5−/−, n = 38; C3742 (10 μM) + smc5−/−, n = 46; PFT‐α (1 μM) + smc5−/−, n = 9; PFT‐α (2 μM) + smc5−/−, n = 46; (F) deletion of tp53 in smc5 knockout (KO) zebrafish rescued the reduced body length. tp53+/+, smc5+/+, n = 9; tp53+/+, smc5−/−, n = 6; tp53−/−, smc5−/−, n = 9. In parts (C–F), values represent the mean ± s.e.m. *p < .05, **p < .01, ***p < .001

Smc5K371del knock‐in mice are small and have a higher embryonic lethality rate. (A) Scheme of the knock‐in strategy for CRISPR/Cas9‐mediated deletion of K371 in mice. The single‐stranded oligodeoxynucleotide (ssODN) was designed with arm sequences and the target site, among which the site for K371del is shown in detail. The protospacer adjacent motif (PAM) site is shown in red, the sgRNA site is shown in blue, and K371 is boxed in orange squares, indicating the point mutation (c.1111_1113delAAG, p.K371del) (upper panel). Sanger sequencing of genomic DNA isolated from mice with the indicated genotypes was shown in the lower panel. (B) Survival curve and genotypes of offspring from Smc5+/K371 intercrosses. p < .001. Log‐rank Mantel–Cox test. (C) Images and weights of embryos at E18.5. (D) Representative photograph of male mice at 15 weeks of age (left), body weight (middle) and body weight gain after feeding a chow diet for 8 weeks (right) (n = 3). (E) The expression of Trp53‐related genes involved in apoptosis and cell cycle detected in mouse embryonic fibroblasts (MEFs) by quantitative real‐time PCR (qPCR). Rplp0 (36B4) was chosen as the internal reference gene. (F) Sections of embryos at E9.5 stained with haematoxylin and eosin (H&E) (scale bar = 500 μm), costained for TUNEL and DAPI, and Ki67 and PH3, respectively (scale bar = 200 μm). In parts (C–E), values represent the mean ± s.e.m. *p < .05, **p < .01, ***p < .001

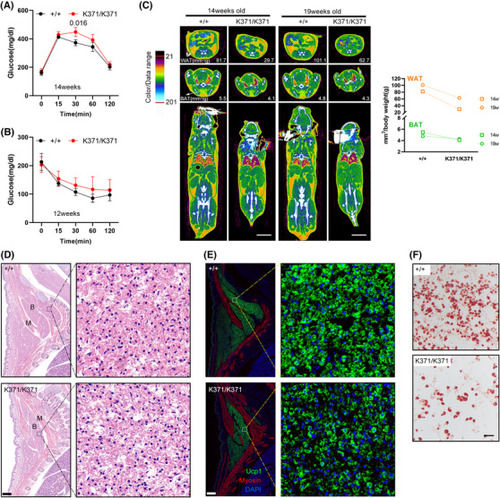
Reduced adiposity in Smc5K371/K371 mice. (A) Glucose levels (assessed by an intraperitoneal glucose tolerance test) at 14 weeks of age were significantly higher in K371/K371 mice than in wild‐type (WT) control mice at the 30‐min time point. (B) In an insulin tolerance test, glucose was reduced to a lesser extent trend in K371/K371 mice than in their WT control counterparts at 12 weeks of age. Pairwise significance compared to controls is shown. In parts (A and B), n = 3 for each group the analysis used two‐way ANOVA with repeated measures and Bonferroni correction (GraphPad Prism 6). All error bars are plotted as a mean value ± s.e.m. (C) Representative two‐dimensional cross‐sectional μCT images in transverse planes of the abdomen (top), scapular (middle) and coronal sections of the whole body (bottom) showing white and brown adipose tissue. Scale bars = 10 mm. The fat volume was quantified and shown in the right panel. (D and E) Histological analysis of E18.5 embryos. Sagittal sections of the cervical/thoracic area were stained with haematoxylin and eosin (H&E) (D) or with antibodies against the brown adipose (B) marker UCP1 (green) and the muscle (M) marker Myosin (red) (E). Scale bar = 400 μm. Boxed regions in each image were magnified and showed details of embryonic brown adipose precursors. Lipid droplets can be seen forming immaturely in the mutants. (F) Oil red O staining of WT and mutant mouse embryonic fibroblasts (MEFs) after 7 days of white adipogenesis. Scale bar = 100 μm

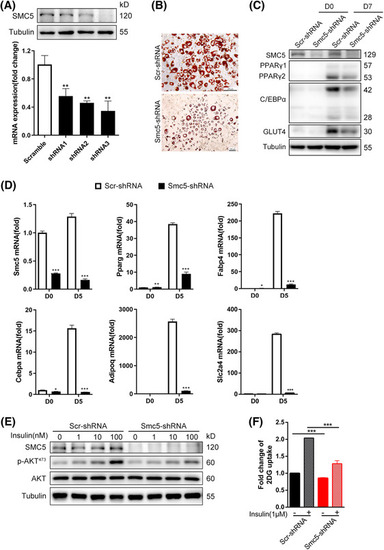
Smc5 is required for 3T3‐L1 adipogenesis. (A) The 3T3‐L1 white preadipocytes were infected with lentivirus shRNAs targeting Smc5 (Smc5‐shRNA) or scramble (Scr‐shRNA) virus, followed by adipogenesis assay. Quantitative real‐time PCR (qPCR) and Western blot confirmation of Smc5 knockdown efficiency before adipogenesis. Values represent the mean ± s.d. (B) Oil red O staining at D7 of adipogenesis. Scale bars = 30 μm. (C) Western blots of PPARγ, C/EBPα and GLUT4 in preadipocytes (D0) and adipocytes (D7). (D) qPCR of Pparg, Cebpa, Fabp4, Adipoq, Slc2a4 expression at D0 and D5 of adipogenesis. Values represent the mean ± s.e.m. (E) Western blots of phosphorylated Akt at Serine 473 and total Akt in protein extracts of adipocytes (D7). (F) Insulin‐stimulated glucose uptake assessed by the 2‐deoxyglucose assay in adipocytes (D7). Values represent the mean ± s.d. In parts (A and D), Rplp0 (36B4) was chosen as the internal reference gene. For parts (A, D and F), the p values were calculated using a two‐sided Student's t‐test. *p < .05, **p < .01 and ***p < .001

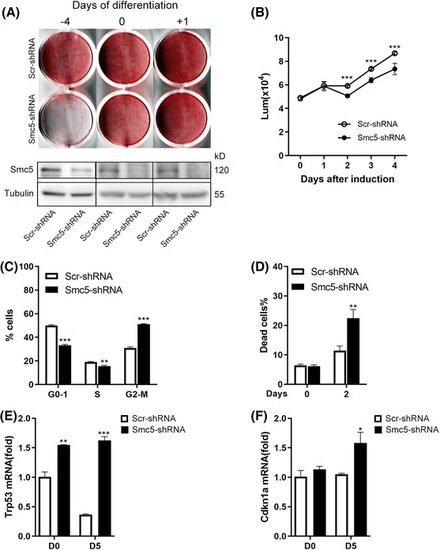
Smc5 is essential for mitotic clonal expansion during adipogenesis. (A) Representative stained plates (top) and Western blots (bottom) of 3T3‐L1 cells infected with Smc5 or scrambled shRNA at different time points, followed by induction of adipogenesis. (B) Relative proliferation of 3T3‐L1 white preadipocyte cells before and after differentiation was assessed by CellTiter‐Glo assay, n = 5. (C) Cell cycle profile by fluorescence‐activated cell sorting (FACS) at D2 of adipogenesis. (D) Quantification of dead cells (7‐AAD) by FACS at D0 and D2 of adipogenesis. (E and F) Quantitative real‐time PCR (qPCR) of Trp53 (p53) and Cdkn1a (p21) expression at D0 and D5 of adipogenesis. Rplp0 (36B4) was chosen as the internal reference gene. The data are presented as the mean ± s.d. in (B–D) and mean ± s.e.m. in (E and F). For parts (B–F), the p values were calculated using a two‐sided Student's t‐test. *p < .05, **p < .01 and ***p < .001

Acknowledgments
This image is the copyrighted work of the attributed author or publisher, and ZFIN has permission only to display this image to its users. Additional permissions should be obtained from the applicable author or publisher of the image. Full text @ Clin Transl Med