IMAGE

FIGURE 2

ID
ZDB-IMAGE-230115-6
Source
Figures for Zhu et al., 2023
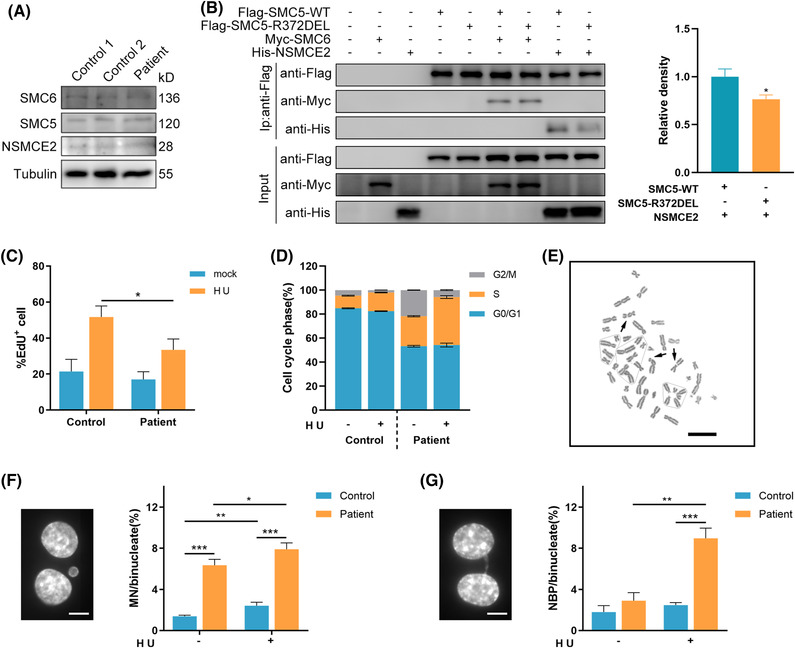
Image
Figure Caption

FIGURE 2

Replication stress exacerbates genome instability in patient's cells. (A) A representative western blot cropped to show unaffected NSMCE2–SMC5–SMC6 subcomplex expression in patient fibroblasts. (B) Interaction between NSMCE2 (N‐terminal HIS) or SMC6 (N‐terminal MYC) and SMC5 (N‐terminal FLAG‐tagged wild‐type (WT) or R372DEL), as determined by immunoprecipitation after transfection in HEK293T cells. Proteins were immunopurified using anti‐FLAG beads. Data are presented as mean ± s.e.m. and n = 5 biological replicates for quantification on the right panel. (C) HU recovery assay. Fibroblasts were incubated with mock or 250‐μM HU for 18 h, labelled with EdU for 30 min, pre‐extracted, fixed and costained for EdU and DAPI. The EdU‐positive cells were quantified. (D) Quantification of cell cycle phases in mock‐ or HU‐treated fibroblasts. n = 2 biological replicates were performed per condition per genotype. (E) Representative image of chromatid gaps or breaks from chromosomal aberration analysis in primary lymphocytes derived from the patient. Black arrows denote acentric fragments. Scale bar, 30 μm. (F and G) Exposure of cells to HU exacerbates micronucleus (F) and nucleoplasmic bridge (G) formation. Fibroblasts were exposed to 1‐mM HU for 4 h, followed by 24‐h recovery in the presence of 3‐μg/ml cytochalasin B, and assessed using fluorescence microscopy. In parts (C, D, F and G), data are presented as the mean ± s.d. *p < .05, **p < .01, ***p < .001 by Student's t‐test

Acknowledgments
This image is the copyrighted work of the attributed author or publisher, and ZFIN has permission only to display this image to its users. Additional permissions should be obtained from the applicable author or publisher of the image. Full text @ Clin Transl Med