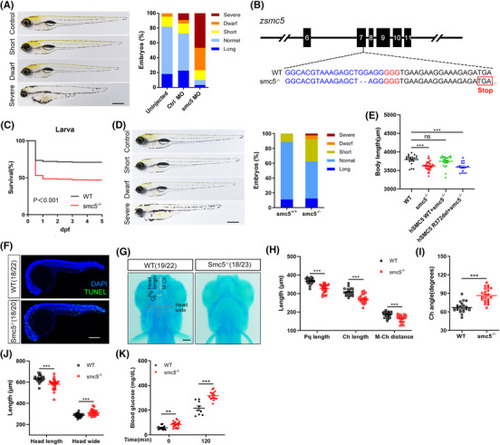
Smc5 deficiency in zebrafish led to short length, increased mortality and impaired glucose homeostasis. (A) Phenotypes and quantification of length in smc5 morpholino (MO)‐injected zebrafish. Representative images of defined length categories: long, >1 SD; normal, −1 to 1 SD; short, −1 to −2 SD; dwarf, −2 to −3 SD; severe, <−3 SD (left); and quantification of different categories (right). Uninjected, n = 22; control MO, n = 22; smc5 MO, n = 30. Scale bar = 500 μm. (B) CRISPR target site in exon 7 of zebrafish smc5 (zsmc5) gene, resulting in 2‐bp deletion allele and premature stop codons (red box). The CRISPR‐guided RNA sequence and the protospacer adjacent motif (PAM) are highlighted in blue and red, respectively. (C) Survival curve over time from wild‐type (WT) and smc5−/− larvae. n = 950 and 962 for WT, smc5−/− larvae, respectively; p < .001. Log‐rank Mantel–Cox test. (D) Phenotypes and quantification of length in smc5 knockout (KO) zebrafish recorded as in (A). Smc5+/+, n = 36; smc5−/−, n = 40. Scale bar = 500 μm. (E) Coinjection of human SMC5 tol2 plasmid (WT or R372del) with transposase mRNA and body length was scored at 5 dpf. WT, n = 21; smc5−/−, n = 34; hSMC5 WT+smc5−/−, n = 24; hSMC5 R372del+smc5−/−, n = 17. (F) TUNEL staining showed numerous apoptotic cells in the brain and posterior segment of spinal cord in smc5−/− embryos at 24 hpf. Scale bar = 250 μm. (G) Representative ventral images of Alcian blue staining of cartilage structures show severe defects in smc5−/− larvae at 5 dpf. Pq, palatoquadrate; Ch, ceratohyal arch; M–Ch, distance from Meckel's cartilage (M) to Ch; the yellow curve indicates Ch angle. WT, n = 22; smc5−/−, n = 23. Scale bars = 100 μm. (H–J) Quantitative analysis of a series of changes of phenotypic indexes, including Pq, Ch and M–Ch length (H), Ch angle (I) and head length and wide (J) in G. (K) The glucose tolerance test in 3‐month‐old WT and smc5−/− zebrafish. Blood glucose was measured at 0 (WT, n = 12; smc5−/−, n = 21) and 120 min (WT, n = 9; smc5−/−, n = 15) after glucose injection. Values represent the mean ± s.e.m. **p < .01, ***p < .001 by Student's t‐test
|
