
- Title
-
Foxq2 determines blue cone identity in zebrafish
- Authors
- Ogawa, Y., Shiraki, T., Fukada, Y., Kojima, D.
- Source
- Full text @ Sci Adv

The loss-of-function analysis for cone-enriched transcription factors.
(A) Relative expression levels of phototransduction genes and transcription factors in isolated rods and cones at the adult stage (means ± SD, n = 2). n.d., not detected. The expression levels of gnat1 and gnat2 genes are reproduced from our previous paper (17). (B) Relative expression levels of sws2 opsin in the larval eyes at 5 days postfertilization (dpf). Means ± SEM. *P < 0.05 by Student’s t test. The number of fish used was as follows: n = 5 [foxq2 wild type (WT)], n = 5 (foxq2 mut); n = 5 (tbx2b WT), n = 5 (tbx2b mut); n = 3 (thrb WT), n = 4 (thrb mut); n = 4 (e2f7 WT), n = 4 (e2f7 mut); n = 3 (nfia WT), n = 4 (nfia mut); n = 4 (nr2f6b WT), n = 4 (nr2f6b mut). See also fig. S3. (C and E) Schematic representation of Foxq2 and Tbx2b and their partial nucleotide sequences. The frameshift site is indicated by an arrowhead. Nucleotide deletions are indicated by dashes. The nucleotide sequences (letters in blue) indicate the target sequences of TAL effector nucleases or Cas9–single-guide RNA (sgRNA) complexes. The recognition sites of the restriction endonucleases, Hae III and Hind III, are surrounded by black lines. The ja74, ja77, and ja20 mutations caused a frameshift of the amino acid (a.a.) sequence of Foxq2 or Tbx2b by 8-, 4-, and 8-bp loss, respectively. (D and F) Expression profiles of phototransduction genes in the 5-dpf larval eyes. Means ± SEM. *P < 0.05 by Student’s t test. The number of fish used was as follows: n = 5 (foxq2 WT), n = 5 (foxq2 mut); n = 5 (tbx2b WT), n = 5 (tbx2b mut). The expression levels of sws2 and rh2 genes are reproduced in (B). UV, ultraviolet. |
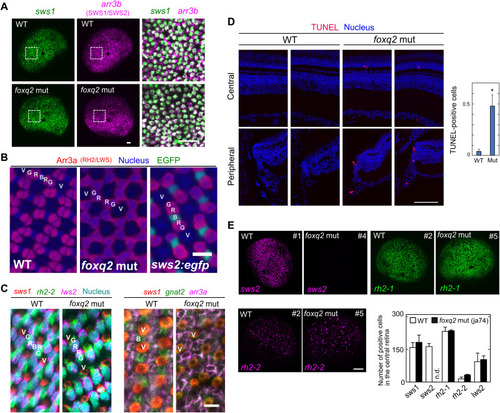
The loss of SWS2 cones in the foxq2 mutant.
(A) Expression patterns of sws1 and arr3b (SWS1 and SWS2 cones) in 5-dpf larval eyes of the foxq2 mut (ja74) examined by in situ HCR. Magnified view (a box surrounded with white lines) is indicated in the right side of each panel. Scale bars, 20 μm. (B) Fluorescent images of the flat-mounted retinas prepared from the adult WT, the foxq2 mut (ja74), and Tg(-3.5opn1sw2:EGFP)kj11Tg (sws2:egfp), where EGFP is expressed in SWS2 cones (green). The retinas were immunostained with zpr1 antibody (arr3a, red) and also stained with DRAQ5 to highlight cell nuclei (blue). V, SWS1 cone; B, SWS2 cone; G, RH2 cone; R, LWS cone. Scale bar, 10 μm. See also fig. S3B. (C) Expression patterns of phototransduction genes in the flat-mounted retinas examined by in situ HCR. See also fig. S3C. (D) Left: Fluorescent images in retinal cryosections from the adult fish labeled for terminal deoxynucleotidyl transferase–mediated deoxyuridine triphosphate nick end labeling (TUNEL) (red). The cell nuclei were counterstained with 4′,6-diamidino-2-phenylindole (DAPI) (blue). Scale bar, 50 μm. Right: Quantification of TUNEL-positive cells in the central and peripheral retina. The numbers of TUNEL-positive cells were counted for each cryosection and averaged (means ± SEM, n = 80 for WT, n = 63 for the foxq2 mut; *P < 0.05, Student’s t test). See also fig. S3D. (E) Expression patterns of sws2, rh2-1, and rh2-2 in 5-dpf larval eyes of WT and foxq2 mut (ja74) examined by in situ HCR. The number of opsin gene–positive cells in the central region of the retina is indicated in a bar graph. The number in the upper-right corner for each panel represents the unique identity of the eye. Data are represented by means ± SEM (n = 3). Scale bar, 50 μm. See also fig. S3E. |

SWS2 cone–enriched expression of foxq2.
(A) Schematic drawing of transgenes for the four transgenic lines each expressing EGFP in SWS1 (V), SWS2 (B), RH2 (G), or LWS (R) cone subtype. See also Materials and Methods. (B and C) Relative expression levels of cone opsin genes (B) and transcription factors (C) among isolated cone subtypes at the adult stage. Mean expression values with SEM (n = 3) are indicated as bars. Distinct letters indicate statistically significant differences (P < 0.05 by Tukey’s multiple comparisons test). n.s., not significant. (D and E) Expression pattern of foxq2 in 3-dpf larval eyes examined by in situ HCR. The foxq2 expression is covisualized with sws2 (D) or with sws1 and arr3a (E). The bottom image is an orthogonal view of the top z-projected image. Scale bars, 25 μm. EXPRESSION / LABELING:
|
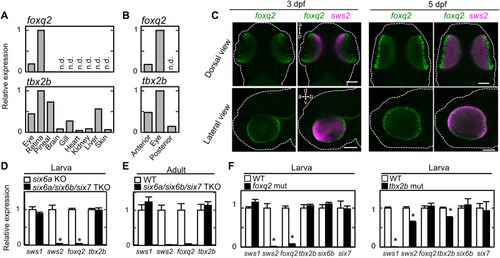
Gene expression profiles of foxq2 and tbx2b.
(A and B) Relative expression levels of foxq2 and tbx2b in adult tissues (A), and 4-dpf larval anterior segments, posterior segments, and eyes (B). (C) Expression pattern of foxq2 and sws2 in 3-dpf and 5-dpf larvae examined by in situ HCR. The larval zebrafish are outlined with white dotted lines. d-v, dorsal-ventral axis; a-p, anterior-posterior axis. Scale bars, 100 μm. (D) Relative expression levels of tbx2b and foxq2 in the 5-dpf larval eyes of the six6a/six6b/six7 triple knockout (TKO). Means ± SEM (n = 5). *P < 0.05 by Student’s t test. Note that the six6a KO was used as the control because it shows normal levels of cone opsin gene expression as compared to the WT [see (20)]. The expression levels of sws2 and rh2 genes are reproduced from our previous paper (20). (E) Relative expression levels of tbx2b and foxq2 in the adult eyes of the six6a/six6b/six7 TKO. All of the fish used here are in the transgenic background, Tg(-3.5opn1sw2:EGFP)kj11Tg, where EGFP is expressed in the SWS2 cone subtype. Data are represented by means ± SD (n = 3, WT; n = 2, six6a/six6b/six7 TKO). The expression levels of sws2 and rh2 genes are reproduced from our previous paper (20). (F) Relative expression levels of cone opsins and transcription factors responsible for photoreceptor gene expression in the eyes of the tbx2b (ja20) and foxq2 (ja74) mutants. Means ± SEM. *P < 0.05 by Student’s t test. The number of fish used was as follows: n = 5 (tbx2b WT), n = 4 (tbx2b mut); n = 5 (foxq2 WT), n = 5 (foxq2 mut). The expression levels of sws2 and rh2 genes in the foxq2 mutant and its control WT are reproduced from Fig. 1D. EXPRESSION / LABELING:
|
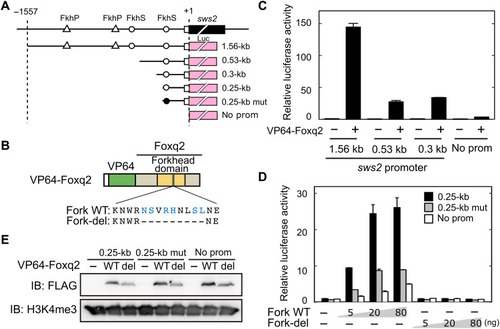
DNA binding of Foxq2 to sws2 promoter.
(A) Schematic structure of the promoter-luciferase reporter constructs for zebrafish sws2. The coding (solid box) and the untranslated (open box) regions of the first exon are indicated. The translational start site is marked as +1. The forkhead binding motif (ACAACA) and its mutant (GTGGTG) are marked as open and closed circles, respectively. See also fig. S6. (B) Schematic representation of VP64-Foxq2 protein. The Foxq2 mutant protein (Fork-del) lacks the canonical Fox base–contacting residues in the forkhead domain. These critical amino acid residues are highlighted in blue according to the previous paper (30). (C and D) Transcriptional assay in human embryonic kidney 293T17 cells using the luciferase reporter containing the promoter region of zebrafish sws2 (means ± SD, n = 2). The luciferase activity derived from the firefly luciferase reporter was normalized to that from the Renilla luciferase reporter. (C) The luciferase activity in each condition was normalized to the mean value obtained from the cells transfected with both empty vector and 1.56-kb sws2 reporter vector (leftmost bar). VP64-Foxq2 expression plasmid (100 ng) was used for the transfection. (D) The amount of VP64-Foxq2 expression plasmid used is indicated. The luciferase activity in each condition was normalized to the mean value obtained from the cells transfected with both the empty expression vector and the 0.25-kb sws2 (0.25 kb) reporter vector (leftmost bar). The slight up-regulation of the luciferase expression in a reporter with no sws2 promoter might be due to an experimental artifact, such as VP64-Foxq2–dependent regulation through the reporter vector-backbone sequence(s) and/or activation of gene(s) regulating the reporter gene expression. (E) Protein expression of VP64-Foxq2 (WT) and its mutant protein (Fork-del) in the cells transfected with 80 ng of the plasmid. The antibody H3K4me3 is served as a loading control. IB, immunoblot. |
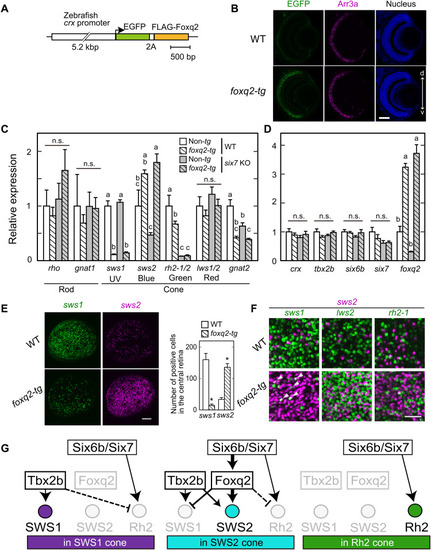
Foxq2-mediated transcriptional regulation of sws2 downstream of Six7.
(A) Schematic drawing of a transgene construct used for generating foxq2-tg. (B) Immunofluorescent image in the foxq2-tg (ja78Tg) larvae at 5 dpf. Scale bar, 50 μm. d-v, dorsal-ventral retina. (C and D) Relative mRNA levels of opsin genes and transcription factors in the 5-dpf larval eyes of the foxq2-tg (ja78Tg) and/or six7 KO (means ± SEM). Distinct letters indicate statistically significant differences (P < 0.05 by Tukey’s multiple comparisons test). The number of fish used was as follows: n = 3 (WT), n = 5 (six7 KO), n = 4 (foxq2-tg), and n = 5 (foxq2-tg/six7 KO). (E) Expression pattern of sws1 and sws2 examined by in situ HCR using 5-dpf larval eyes of the foxq2-tg. The number of opsin gene–positive cells in the central region of the retina is indicated in a bar graph. Data are represented by means ± SEM (n = 6). Statistical significance between two genotype was determined by Student’s t test (*P < 0.05). See also fig. S7E. Scale bar, 50 μm. (F) Comparison of expression pattern of sws2 with that of sws1, rh2-2, or lws2 examined by in situ HCR using 5-dpf larval eyes of the foxq2-tg (ja78Tg). Some sws1 expression signals are colocalized with those of sws2 in the foxq2-tg eye (arrowheads). See also fig. S7 (E and G). Scale bar, 20 μm. (G) Hypothetical model of transcriptional network accounting for sws1, sws2, and rh2 opsin expression in the SWS1, SWS2, and RH2 cones. The mechanism(s) underlying the repression of rh2 expression in SWS1 and SWS2 cones remains elusive, and hence, these potential regulations are shown by broken lines. EXPRESSION / LABELING:
|
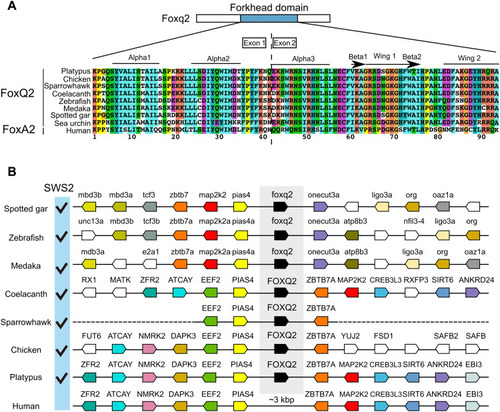
FOXQ2 gene conservation among animal species.
(A) Sequence alignment of forkhead domain of FOXQ2 and FOXA2 proteins. Secondary structure elements are indicated at the top according to the FOXA2-DBD/DBE2 complex in the previous study (63). (B) Genomic environment of FOXQ2 genes in vertebrate species. Orthologous genes contributing to the conserved order of FOXQ2 genes among vertebrates are similarly color-coded. The presence of SWS2 gene in each species is indicated as checkmarks according to the previous study (64). Accession numbers for the genomic location of FOXQ2 in each species are indicated in table S6. |