
Fig. 6
|
Fig. 6
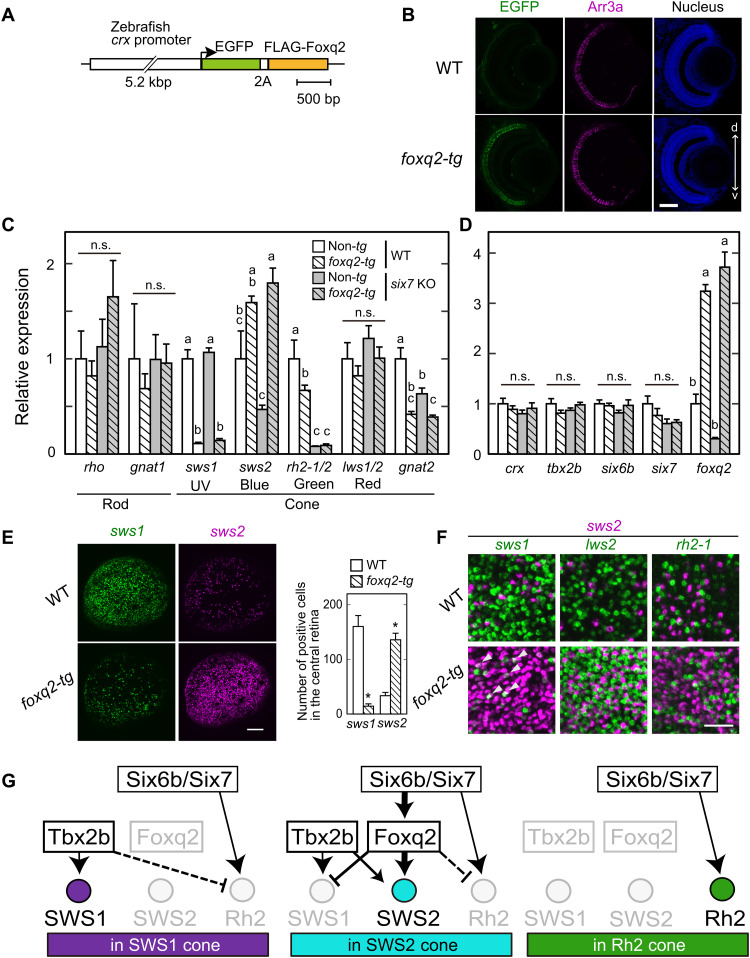
(A) Schematic drawing of a transgene construct used for generating foxq2-tg. (B) Immunofluorescent image in the foxq2-tg (ja78Tg) larvae at 5 dpf. Scale bar, 50 μm. d-v, dorsal-ventral retina. (C and D) Relative mRNA levels of opsin genes and transcription factors in the 5-dpf larval eyes of the foxq2-tg (ja78Tg) and/or six7 KO (means ± SEM). Distinct letters indicate statistically significant differences (P < 0.05 by Tukey’s multiple comparisons test). The number of fish used was as follows: n = 3 (WT), n = 5 (six7 KO), n = 4 (foxq2-tg), and n = 5 (foxq2-tg/six7 KO). (E) Expression pattern of sws1 and sws2 examined by in situ HCR using 5-dpf larval eyes of the foxq2-tg. The number of opsin gene–positive cells in the central region of the retina is indicated in a bar graph. Data are represented by means ± SEM (n = 6). Statistical significance between two genotype was determined by Student’s t test (*P < 0.05). See also fig. S7E. Scale bar, 50 μm. (F) Comparison of expression pattern of sws2 with that of sws1, rh2-2, or lws2 examined by in situ HCR using 5-dpf larval eyes of the foxq2-tg (ja78Tg). Some sws1 expression signals are colocalized with those of sws2 in the foxq2-tg eye (arrowheads). See also fig. S7 (E and G). Scale bar, 20 μm. (G) Hypothetical model of transcriptional network accounting for sws1, sws2, and rh2 opsin expression in the SWS1, SWS2, and RH2 cones. The mechanism(s) underlying the repression of rh2 expression in SWS1 and SWS2 cones remains elusive, and hence, these potential regulations are shown by broken lines.