FIGURE SUMMARY
Title

Insulin-like 3 affects zebrafish spermatogenic cells directly and via Sertoli cells

Authors
Crespo, D., Assis, L.H.C., Zhang, Y.T., Safian, D., Furmanek, T., Skaftnesmo, K.O., Norberg, B., Ge, W., Choi, Y.C., den Broeder, M.J., Legler, J., Bogerd, J., Schulz, R.W.
Source
Full text @ Commun Biol

Rxfp2a and Rxfp2b mediate Insl3 action in the zebrafish testis.

A Effects of zebrafish Insl3 on four relaxin family peptide receptors (Rxfps) expressed in HEK293T cells transiently transfected with pcDNA3.1 and pCRE plasmids. Data are expressed as mean ± SEM (N = 3, technical replicates). Numbers in brackets indicate the EC50 concentrations. AU, arbitrary units. B Expression levels of responsive Insl3 receptors in control, germ cell-depleted (by exposure to the cytostatic agent busulfan51), and testes with recovering (from busulfan) spermatogenesis, as described by Crespo et al.25 (NCBI GEO data set GSE116611). Data are expressed as mean ± SEM (N = 5; *p < 0.05). C, D Localization of rxfp2a:EGFP (green; C) and rxfp2b:mCherry signal (red; D) in adult testis tissue. Confocal laser scanning microscopy analysis of whole-mount testes shows preferential expression of EGFP and mCherry in type A spermatogonia and Sertoli and myoid cells, respectively. DAPI counterstain is shown in gray. Representative germ cell types (insets 1–4) and Sertoli and myoid cells are shown (insets 5–6). Aund, type A undifferentiated spermatogonia; Adiff, type A differentiating spermatogonia; B, type B spermatogonia; SPC, spermatocytes. In D, red and white arrowheads indicate representative mCherry+ and mCherry somatic cells, respectively. Scale bars, 25 µm.

Genetic ablation of the <italic>insl3</italic> gene results in increased germ cell apoptosis in the zebrafish testis.

AC Body weight (A), gonado-somatic indices (GSI; B) and testicular morphology (C) of wild-type (insl3+/+) and insl3 knockout (insl3−/−) males 9 and 12 months post-fertilization. Data are mean ± SEM (insl3+/+ and insl3−/−, 9 months: N = 8 and 13; insl3+/+ and insl3−/−, 12 months: N = 8 and 15; p < 0.05; **p < 0.01; ***p < 0.001). In C, yellow dashed lines indicate representative apoptotic germ cell cysts. Scale bars, 25 µm. D, E Quantitative analysis of spermatogenesis (D) and transcript levels of growth factors, steroidogenesis-related and Insl3 receptors (E) in 12 months-old insl3+/+ and insl3−/− adult testis tissue. Data are mean ± SEM (insl3+/+ and insl3−/−: N = 6 and 10; *p < 0.05; **p < 0.01) and, in E, expressed as relative to the wild-type group (which is set at 1; dashed line). Aund, type A undifferentiated spermatogonia; Adiff, type A differentiating spermatogonia; B, type B spermatogonia; SPC, spermatocytes; SPT, spermatids; SPZ, spermatozoa; Others, including (i) empty spaces lined by Sertoli and/or germ cells that are not part of the lumen, (ii) Sertoli cell only areas, and (iii) apoptotic cells (see Supplementary Fig. 2 for further details); SC, Sertoli cell; LC, Leydig cell.

Confirmation of germ cell apoptosis/DNA damage in <italic>insl3</italic> knockouts by TUNEL analysis.

AC Detection (A, B) and quantification (C) of germ cell apoptosis/DNA damage in wild-type (insl3+/+) and insl3 knockout (insl3−/−) testes 9 and 12 months post-fertilization. In A, white arrowheads and arrows indicate representative TUNEL+ spermatogonia and Sertoli cells, and gray arrowheads and arrows indicate representative TUNEL+ spermatids and spermatocytes, respectively. In B, representative TUNEL+ spermatogonia (SPG), spermatocyte (SPC) or spermatid (SPT) cysts are encircled with a white dashed line, and a TUNEL+ Sertoli cell (SC) is indicated by a white arrowhead. TUNEL+ cells/cysts are shown in green and propidium iodide (PI) counterstain is red. Scale bars, 25 µm. D Transcript levels of anti- (xiap) a pro-apoptotic (casp9) genes in insl3+/+ and insl3−/− testis tissue 9 and 12 months post-fertilization. TUNEL quantification results are shown as mean ± SEM (insl3+/+ and insl3−/−, 9 months: N = 4 and 7; insl3+/+ and insl3−/−, 12 months: N = 3 and 10; *p < 0.05; **p < 0.01), and gene expression data as mean fold change ± SEM (insl3+/+ and insl3−/−, 9 months: N = 8 and 7; insl3+/+ and insl3−/−, 12 months: N = 6 and 10; *p < 0.05) and expressed relative to the wild-type group (which is set at 1).

EXPRESSION / LABELING:
Genes:
Fish:
Anatomical Term:
Stage: Adult

Gene expression profiling of testis tissue in response to Insl3.

A Total numbers of up-regulated and down-regulated genes (DEGs) identified by RNAseq (N = 3; p < 0.05). To generate testis samples for RNAseq, male zebrafish testes were incubated in the absence or presence of zebrafish Insl3 (100 ng/mL) for 2 days. FC fold change. B, C Insl3-regulated KEGG pathways (B) and Gene Ontology terms (C) in adult zebrafish testis tissue. KEGG pathways represented by at least three DEGs and ratio of regulated genes (down-regulated/up-regulated) higher than 2 were considered for the analysis. In C, number of identified genes is shown in brackets and enrichment significance (FDR, false discovery rate) is represented as a color gradient. D Selected DEGs identified by KEGG and GO analyses grouped by their function. Fold change values are shown with a red or green background indicating up-regulation or down-regulation, respectively.

Involvement of retinoic acid (RA) signaling in Insl3-induced spermatogenesis.

A, B Evaluation of the proliferation activity (A) and of the proportions of spermatogonia (B) in zebrafish testes cultured for 4 days with 100 ng/mL Insl3, and in the absence or presence of the RA inhibitor DEAB (10 μM). C Ex vivo transcript levels of the RA producing (aldh1a2) and degrading enzymes (cyp26a1) in testis tissue incubated in the absence or presence of 100 ng/mL Insl3. Daldh1a2 and cyp26a1 expression levels in wild-type (insl3+/+) and insl3 knockout (insl3−/−) testes 9 and 12 months post-fertilization. E Read numbers (RNAseq) of RA metabolic enzymes in control, germ cell-depleted (by exposure to the cytostatic agent busulfan51), and testes with recovering (from busulfan) spermatogenesis, as described by Crespo et al.25 (NCBI GEO data set GSE116611). In A, B and E, data are shown as mean ± SEM (AN = 6; BN = 4; EN = 5; *p < 0.05; **p < 0.01), and in C, D as mean fold change ± SEM (C: N = 7; Dinsl3+/+ and insl3−/− 9 months, N = 8 and 7; insl3+/+ and insl3−/− 12 months, N = 6 and 10; *p < 0.05) and expressed relative to the control group (which is set at 1). Aund, type A undifferentiated spermatogonia; Adiff, type A differentiating spermatogonia; B, type B spermatogonia.

EXPRESSION / LABELING:
Genes:
Fish:
Condition:
Anatomical Term:
Stage: Adult
PHENOTYPE:
Fish:
Condition:
Observed In:
Stage: Adult

Pparg involvement in Insl3-induced spermatogenesis.

A, B Evaluation of the proportions (A) and of the proliferation activity of spermatogonia (B) in zebrafish testes cultured for 4 days in the absence or presence of the Pparg antagonist T0070907 (10 μM). C Area occupied by different types of spermatogonia in wild-type (pparg+/+) and pparg knockout (pparg−/−) adult testes. Two different pparg-/- mutants (alleles 1220 and 1737) were evaluated. D In vivo pparg expression levels in wild-type (insl3+/+) and insl3 knockout (insl3-/-) testes 9 and 12 months post-fertilization (left panel), and in control, germ cell-depleted (by exposure to the cytostatic agent busulfan51), and testes with recovering (from busulfan) spermatogenesis, as described by Crespo et al.25 (NCBI GEO data set GSE116611) (right panel). In AC and right panel in D, data are shown as mean ± SEM (A, BN = 6; Cpparg+/+, pparg−/− sa1220 and pparg−/− sa1737, N = 2, 3 and 4; DN = 5; *p < 0.05; **p < 0.01), and in the left panel in D as mean fold change ± SEM (insl3+/+ and insl3−/−, 9 months: N = 8 and 7; insl3+/+ and insl3−/−, 12 months: N = 6 and 10; *p < 0.05; **p < 0.01) and expressed relative to the control group (which is set at 1). In C, different letters indicate significant differences between groups (*p < 0.05). Aund, type A undifferentiated spermatogonia; Adiff, type A differentiating spermatogonia; B, type B spermatogonia.

EXPRESSION / LABELING:
Gene:
Fish:
Condition:
Anatomical Term:
Stage: Adult
PHENOTYPE:
Fish:
Condition:
Observed In:
Stage: Adult

Schematic illustration showing the endocrine and paracrine regulation of zebrafish Insl3 and the stages of spermatogonial development affected.

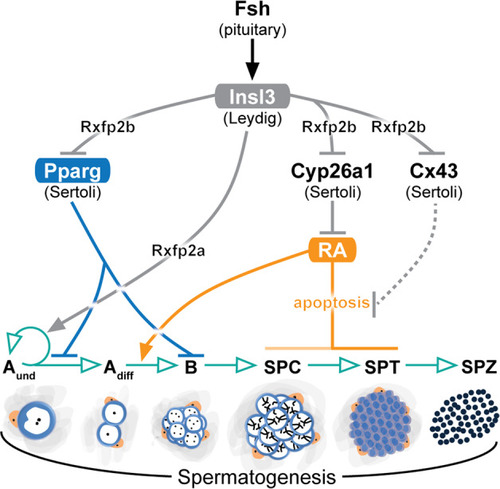
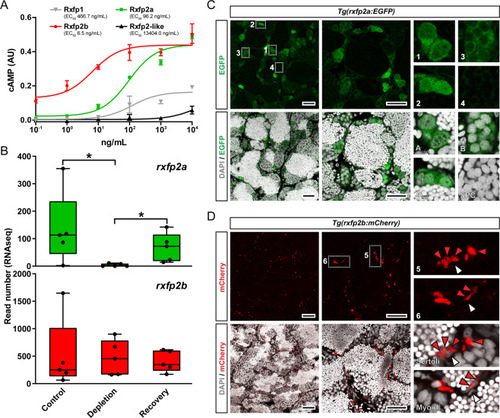
Described effects are indicated by black (Fsh), gray (Insl3), blue (Pparg), and orange (RA) arrows, while germ cell development or germ cell-mediated effects are indicated in green. Gray dashed line denotes no experimental evidence reported. Fsh, follicle-stimulating hormone; Insl3, insulin-like 3; Pparg, peroxisome proliferator-activated receptor gamma; RA, retinoic acid; Cx43, connexin 43; Rxfp2a, relaxin family peptide receptor 2a; Rxfp2b, relaxin family peptide receptor 2b; Aund, type A undifferentiated spermatogonia; Adiff, type A differentiating spermatogonia; B, type B spermatogonia; SPC, spermatocytes; SPT, spermatids; SPZ, spermatozoa; Leydig, Leydig cell; Sertoli, Sertoli cell.

Acknowledgments
This image is the copyrighted work of the attributed author or publisher, and ZFIN has permission only to display this image to its users. Additional permissions should be obtained from the applicable author or publisher of the image. Full text @ Commun Biol