|
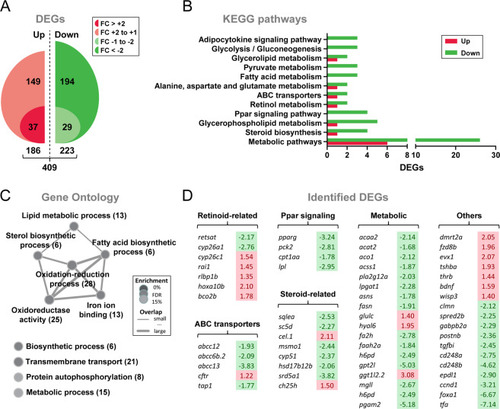
Gene expression profiling of testis tissue in response to Insl3.A Total numbers of up-regulated and down-regulated genes (DEGs) identified by RNAseq (N = 3; p < 0.05). To generate testis samples for RNAseq, male zebrafish testes were incubated in the absence or presence of zebrafish Insl3 (100 ng/mL) for 2 days. FC fold change. B, C Insl3-regulated KEGG pathways (B) and Gene Ontology terms (C) in adult zebrafish testis tissue. KEGG pathways represented by at least three DEGs and ratio of regulated genes (down-regulated/up-regulated) higher than 2 were considered for the analysis. In C, number of identified genes is shown in brackets and enrichment significance (FDR, false discovery rate) is represented as a color gradient. D Selected DEGs identified by KEGG and GO analyses grouped by their function. Fold change values are shown with a red or green background indicating up-regulation or down-regulation, respectively.
|