
Fig. 6
- ID
- ZDB-IMAGE-210227-11
- Genes
- Publication
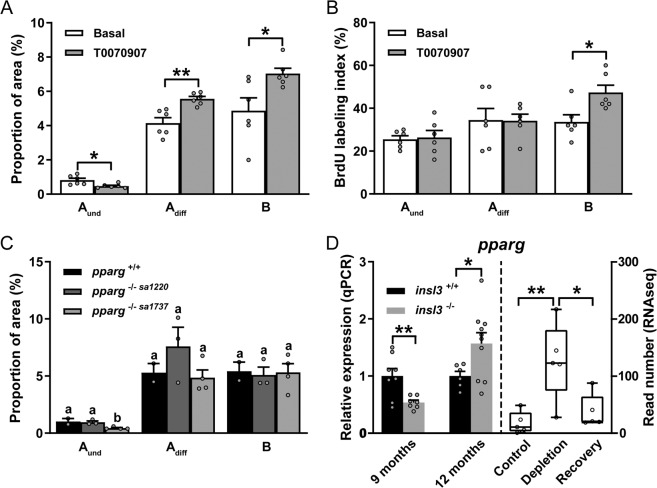
- Crespo et al., 2021 - Insulin-like 3 affects zebrafish spermatogenic cells directly and via Sertoli cells
- All Figures
- Figures for Crespo et al., 2021
|
Fig. 6