- Title
-
Resolving Heart Regeneration by Replacement Histone Profiling
- Authors
- Goldman, J.A., Kuzu, G., Lee, N., Karasik, J., Gemberling, M., Foglia, M.J., Karra, R., Dickson, A.L., Sun, F., Tolstorukov, M.Y., Poss, K.D.
- Source
- Full text @ Dev. Cell
|
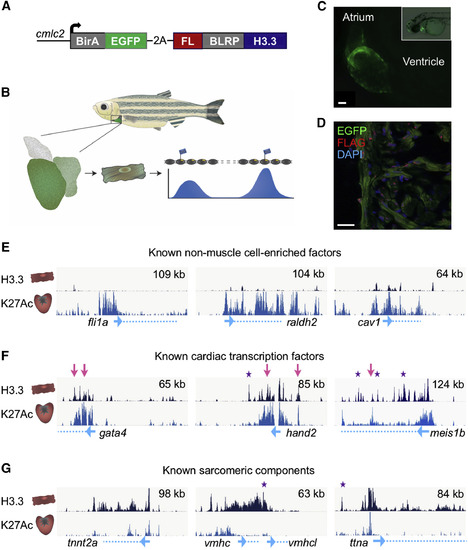
Profiling of H3.3 Occupancy in Adult Zebrafish CMs (A) The structure of the cmlc2:H3.3-bio transgene. EGFP is fused to a biotin ligase (BirA) followed by an in-frame 2A peptide sequence for polycistronic expression with the zebrafish histone H3.3 gene H3f3d. Fused in-frame to H3.3 are sequences coding an N-terminal FLAG and biotin ligase recognition peptide (BLRP). (B) Schematic of H3.3-bio profiling. (C) cmlc2:H3.3-bio larva 2 days post fertilization, showing cardiac EGFP expression. Scale bar, 20 μm. (D) CMs (green) from adult uninjured cmlc2:H3.3-bio hearts contain nuclear H3.3-bio, detected with an anti-FLAG antibody (red). Scale bar, 20 μm. (E) Genome browser snapshots indicating sparse H3.3 enrichment in and around genes with little or no expression in CMs (top track, dark blue). H3K27Ac from whole hearts (bottom track, light blue) is enriched around all promoters (blue arrows) and some gene bodies (dashed blue lines). y axis = enrichment of H3.3 = (Nc + 1)/(Nc)/(Ni + 1)/(Ni), where Nc = H3.3 ChIP, Ni = Input (top left). Top right, x axis (kb). (F) Cardiac transcription factors are enriched with H3.3 throughout the gene body and in nearby intergenic regions. Many H3.3 peaks overlap with enrichment of H3K27Ac (pink arrows). Many other peaks are only enriched for H3.3 (purple stars). (G) Sarcomeric protein genes are enriched for both H3.3 and H3K27Ac; however, there are many more H3.3 occupancy peaks. EXPRESSION / LABELING:
|
|
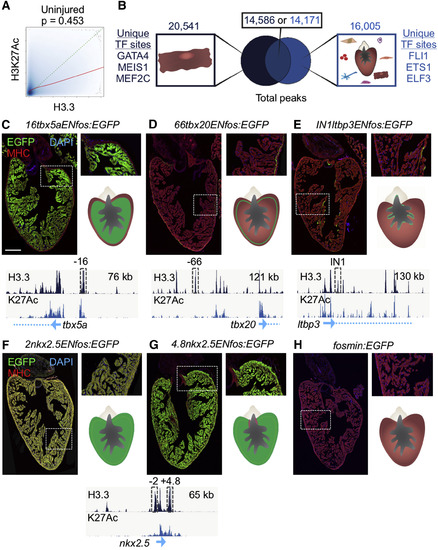
H3.3 Profiling Reveals Enhancer Elements that Direct Expression in CMs (A) H3.3 enrichment (x axis) and H3K27Ac enrichment (y axis) correlate (Pearson’s test, p = 0.454) in uninjured ventricles. The actual trend line between H3.3 and H3K27Ac is shown in red, and a hypothetical perfect correlation trend line is shown in dashed green. (B) Overlap of H3.3 (dark blue) and H3K27Ac (light blue) peaks from samples containing uninjured adult CMs. Top: the total peak numbers in each group. Predicted binding sites for transcription factors active in CMs (GATA4, MEIS1, MEF2C) were found in H3.3-only peaks. H3K27Ac-only peaks contained sequences homologous to binding sites of factors not recognized to be present in CMs (see Table S1). (C–H) H3.3 peaks near cardiac transcription factor genes identify transcriptional enhancers directing expression in different CM subtypes. Transgenic fish contained stable enhancer reporter constructs with the H3.3 peak subcloned upstream of the minimal c-fos promoter driving EGFP. The dashed gray box shows the cloned H3.3 peak from within the browser tracks. A DNA region 16 kb upstream of tbx5a (16tbx5aENfos:EGFP) directs EGFP in trabecular CMs (C). A region 66 kb upstream of tbx20 (66tbx20ENfos:EGFP) directs EGFP in CMs in the single CM-thick primordial layer (D). A region within the first intron of ltbp3 (IN1ltbp3ENfos:EGFP) directs expression sporadically in CMs adjacent to the endocardial cell layer (E). A region 2 kb upstream of nkx2.5 (2nkx2.5ENfos:EGFP) directs expression broadly in ventricular CMs and weakly in smooth muscle of the outflow tract (F). A region 5 kb downstream of the nkx2.5 transcription start site (4.8nkx2.5ENfos:EGFP) directs expression in all CMs except those adjacent to the valve (G). Control transgenic fish containing only the c-fos minimal promoter express little or no detectable cardiac EGFP (H). Scale bar, 200 μm. EXPRESSION / LABELING:
|
|
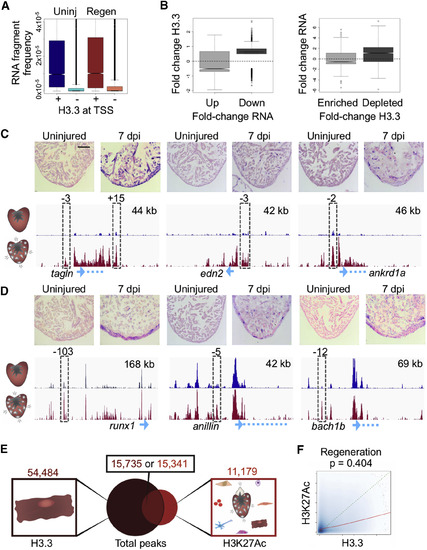
H3.3 Profiles Identify Genes Changing Expression during Regeneration (A) Promoters that contain H3.3 have an increased frequency of RNA expression. RNA-seq fragment frequencies in uninjured (blue) and regenerating (red) hearts correlate with score/height of the highest H3.3 peak at transcription start sites (TSS, ±2 kb). Kolmogorov-Smirnov test, p < 2.2 × 10⁻¹⁶ for each comparison (uninjured and regeneration). (B) Changes in H3.3 occupancy correlate with changes in mRNA abundance (RNA-seq). Left: fold change in enrichment of H3.3 in promoter regions for genes with increased (Up) or decreased (Down) expression during regeneration. Only fold changes with abs(log2(FC)) > 0.5 were considered. Right: fold change of gene expression for genes either enriched with or depleted of H3.3 at their promoter regions. False discovery rate <0.01. Pearson score (left to right): 0.064, −0.019, 0.043, 0.072. (C) In situ hybridization (ISH) evidence that emerging/increasing H3.3 peaks indicate changes in gene expression. Top: uninjured ventricular apices (left) show little detectable signal, whereas hearts 7 days after induction of ablation (7 dpi) indicate gene expression by a violet signal. Bottom: probes were designed toward transcripts highlighted in blue at the bottom of the genome browser shot. The tracks show enrichment of H3.3 from uninjured (blue) and regenerating (red) profiles (see STAR Methods). Peaks assayed for enhancer activity in transgenic reporters are indicated by a dashed gray box (see Figure S3). Genes with H3.3 increasing throughout the locus also mark genes that increase mRNA levels as gauged by ISH. Zebrafish smooth muscle actin (tagln), sarcomeric stress protein cardiac muscle ankyrin repeat domain 1a (ankrd1a), and hormone endothelin2 (edn2) have H3.3 increasing throughout gene bodies. Scale bar, 125 μm. (D) Transcription factors runx1 and bach1b, and cytokinesis factor anillin each have static H3.3 at TSSs (blue arrow) but increasing H3.3 at nearby putative enhancers, and each show regeneration-responsive ISH signals. Top right, x axis. See Figure S2 for other examples. Scale bar, 125 μm. (E) CM H3.3 and whole-ventricle H3K27Ac peak overlap during regeneration is similar to that from uninjured hearts (see Figure 2A). A total of 38,905 peaks are detected only by H3.3 enrichment. Total numbers of peaks are displayed at the top. (F) H3.3 enrichment (x axis) and H3K27Ac enrichment (y axis) correlate in regenerating ventricles (Pearson’s test, p = 0.404). The actual trend line between H3.3 and H3K27Ac is shown in red, and a hypothetical perfect correlation trend line is shown in dashed green. EXPRESSION / LABELING:
|
|
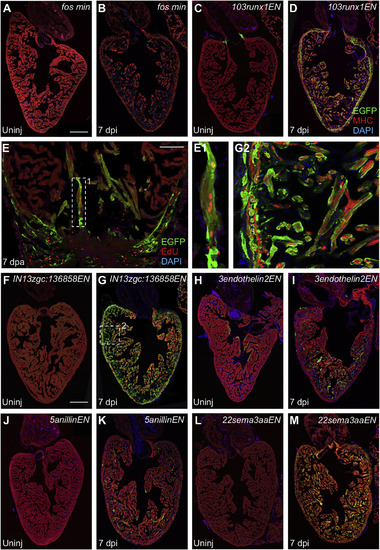
Regeneration Enhancers Direct Gene Expression in CMs after Injury (A and B) Uninjured adult hearts from transgenic reporter lines containing the c-fos minimal promoter alone do not express EGFP whether uninjured (Uninj) or after induced ablation of CMs (7 dpi). Scale bar, 200 μm. (C and D) Uninjured 103runx1ENfos:EGFP animals express EGFP in CMs adjacent to valves. Ablation injury induced EGFP throughout regenerating CMs, most obvious in the compact layer. Scale bar, 200 μm. (E) EGFP fluorescence is induced at 103runx1ENfos:EGFP injury sites at 7 days after apical resection (7 dpa). EGFP-positive CMs at the site of injury in 103runx1ENfos:EGFP hearts incorporate EdU (red). Scale bar, 200 μm. (E1) High-magnification view of box 1 in (E). (F and G) IN13unkENfos:EGFP hearts have low myocardial EGFP fluorescence that is enhanced by ablation injury. Scale bar, 200 μm. (G2) High-magnification view of box 2 in (G). (H and I) 3endothelin2ENfos:EGFP animals express EGFP in CMs near the ventricular lumen and occasionally in the compact layer. Expression increases in regenerating CMs at 7 dpi. (J and K) 5anillinENfos:EGFP animals display EGFP sporadically in uninjured hearts. Expression increases in regenerating CMs after induced ablation of CMs. (L and M) 22sema3aaENfos:EGFP zebrafish show induced expression throughout CMs only after injury. An antibody against myosin heavy chain (MHC, red) was used to stain cardiac muscle. See also Figure S5. |
|
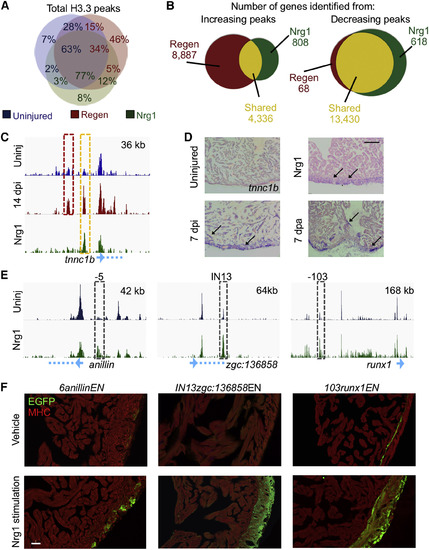
Shared Histone Dynamism Signatures between Injury- and Nrg1-Induced CM Proliferation (A) The Nrg1 H3.3 profile (green) overlaps more with the regeneration profile (red) than the uninjured profile (blue). The percentages represent the fraction of the total for each group and are labeled with color codes. For example, 12% of Nrg1 peaks overlap with 5% of regeneration peaks, neither of which overlap with the uninjured. However, the Nrg1 H3.3 profile only overlaps with 10% of the total peaks emerging during regeneration (5%/5% + 46%). (B) Left: H3.3 peaks near 4,336 genes that increase during regeneration with respect to uninjured CMs also increase during Nrg1-stimulated hyperplasia (yellow). See Table S2. Many peaks increase H3.3 occupancy only during regeneration (red) or Nrg1 stimulation (green). Right: genes identified near H3.3 peaks that decrease from the uninjured profile highly overlap between regenerating and Nrg1-stimulated CM samples (13,340 total or 99% of regeneration [Regen] and 96% of Nrg1 peaks). See Table S5. (C) The tnnc1b gene is located just downstream of a regeneration-specific H3.3 enrichment site (red box) and a site enriched with H3.3 during regeneration and Nrg1 stimulation (yellow box). (D) ISH shows visual increases of the tnnc1b transcript (violet signals, arrows) in ventricles regenerating from ablation (7 dpi) and resection (7 dpa), and in ventricles overexpressing Nrg1. Scale bar, 125 μm. (E) Genome browser tracks indicating H3.3 occupancy responses during Nrg1 stimulation of three sequences used to generate CREE reporter lines (dashed boxes). The two tracks show enrichment of H3.3 in uninjured (blue) and Nrg1-stimulated (green) ventricles. Genes are cartooned at the bottom in light blue. Top right: x axis. (F) CREE reporters 5anillinENfos:EGFP (left), IN13zgc:136858ENfos:EGFP (middle), and 103runx1ENfos:EGFP (right) induce EGFP in CMs in the ventricular wall during transgenic Nrg1 stimulation. An antibody against myosin heavy chain (MHC, red) was used to stain cardiac muscle. Scale bar, 50 μm. See also Figure S6. |
|
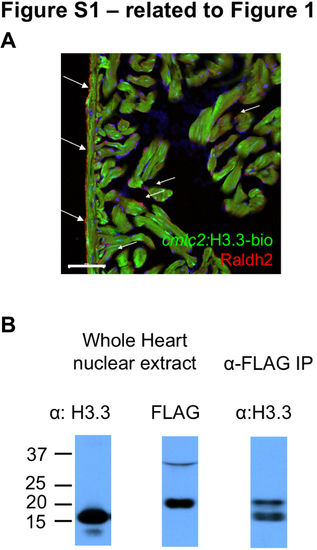
H3.3-bio is Present Sub-stoichiometrically to Endogenous H3.3 Protein (related to Figure 1) (A) cmlc2:H3.3-bio does not drive expression (green) in epicardium and endocardium. Both non-muscle cell types are recognized by an antibody against Raldh2 (arrows; red). Scale bar, 50 μm. (B) Endogenous H3.3 is expressed in excess of transgenic H3.3-bio, which is undetectable using anti-H3.3 (lane 1). However, H3.3-bio can be detected from whole hearts using anti-FLAG (lane 2). Immunoprecipitation of H3.3-bio chromatin using the FLAG antibody enriches both forms of H3.3 (lane 3). |
|
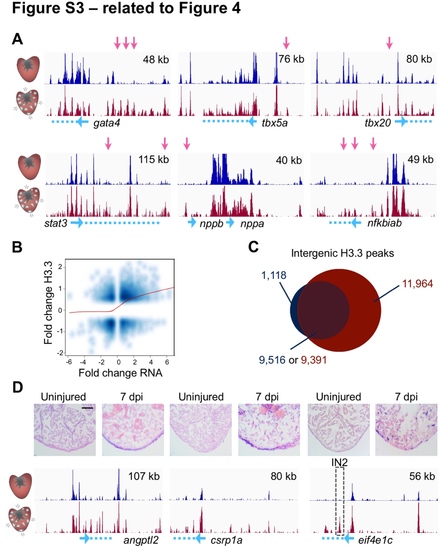
Dynamic H3.3 Enrichment Near Genes with Expression Changes During Regeneration (related to Figure 4) (A) Genome browser snapshots of uninjured (top track, dark blue) and regenerating (bottom track, dark red) H3.3 profiles are shown around genes previously known to be induced in CMs during regeneration. Pink arrows highlight differential H3.3 peaks. Genes are cartooned at the bottom in blue. Top right, x-axis. (B) Correlation of changes in RNAseq and changes in H3.3 occupancy (Pearson = 0.33). (C) Venn diagram showing there are 11,964 intergenic peaks that are detectable only in regenerating CMs versus uninjured CMs. These peaks emerge in the vicinity of 5,232 genes (see Table S2). (D) Extracellular matrix protein gene angptl2, transcription factor gene csrp1a, and translation elongation factor gene eif4e1c all have increased expression during regeneration. Peaks used to generate reporters are marked by a dashed box (see Figure S4). In situ hybridization signals (violet) appear to reflect increases observed in H3.3 enrichment during regeneration (bottom tracks). Scale bar, 125 μm. EXPRESSION / LABELING:
|
|
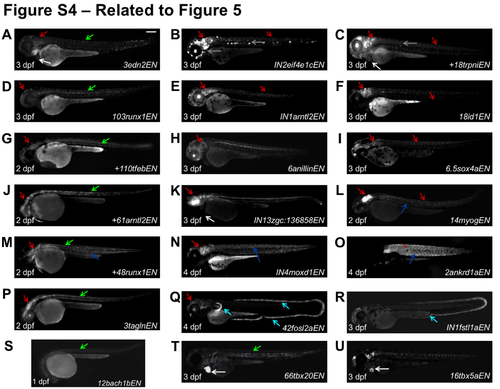
H3.3 Peaks that Increase During Regeneration Show Enhancer Activity in Larvae (related to Figure 5) Many H3.3 peaks that increase or emerge during heart regeneration direct non-cardiac expression domains. The EGFP channel is shown for 2, 3 or 4 dpf larvae as labeled (bottom left). EGFP expression was detected at low levels in heart (white arrows) for (A, C, K). Expression in notochord (green), central nervous system (red), neuromasts (grey), skeletal muscle (blue) and fin fold (cyan) are indicated by colored arrows (see Table S3). Scale bar, 200 μm. |
|
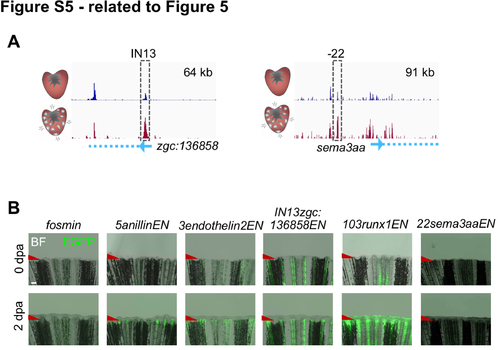
Additional CM Regeneration Enhancer Elements (CREEs) (related to Figure 5)
(A) Genome browser snapshots showing enrichment of H3.3 from uninjured (top track, dark blue) and regenerating CMs (bottom track, dark red). Dashed grey box shows the loci with increasing H3.3 used to generate the IN13zgc136858ENfos:EGFP and 22sema3aaENfos:EGFP enhancer reporter lines. Transcription start sites, blue arrows. Gene bodies, blue dashed line. Top right, x-axis. (B) Three of five CREE transgenics (generated with elements 5anillinEN, 3endothelin2EN, and 103runx1EN) showed induced EGFP 2 days after amputation (2 dpa) of caudal fins. BF, bright field. Scale bar, 200 μm. |
|
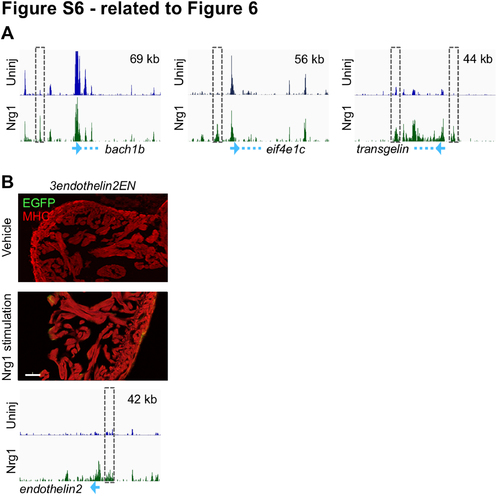
Regions that Increase in H3.3 Occupancy During Nrg1 Stimulation Mark CM Proliferation Enhancers (related to Figure 6) (A) Genome browser snapshots showing H3.3 enrichment from uninjured (top track, blue) and Nrg1-stimulated CMs (bottom track, green). Blue arrows at the bottom signify the promoter with the direction of transcription, and the dashed blue line is the location of the gene body. The size of the region displayed (x-axis) is indicated in the top right of the browser. Regions around these genes are the same as those in shown in Figure 4C, 4D and S4D. (B) EGFP fluorescence is not induced in 3endothelin2ENfos:EGFP animals during transgenic Nrg1 stimulation. An antibody against Myosin Heavy Chain (MHC, red) was used to stain cardiac muscle. Scale bar, 50 μm. |
Reprinted from Developmental Cell, 40, Goldman, J.A., Kuzu, G., Lee, N., Karasik, J., Gemberling, M., Foglia, M.J., Karra, R., Dickson, A.L., Sun, F., Tolstorukov, M.Y., Poss, K.D., Resolving Heart Regeneration by Replacement Histone Profiling, 392-404.e5, Copyright (2017) with permission from Elsevier. Full text @ Dev. Cell

