
FIGURE
Fig. S4
Fig. S4
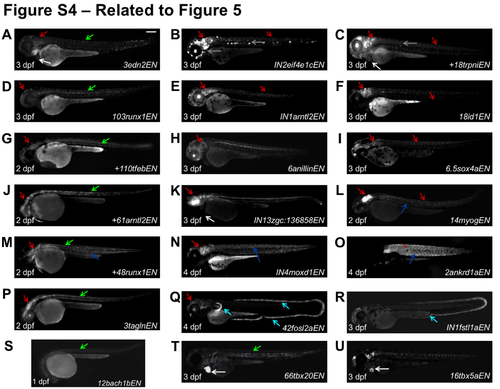
H3.3 Peaks that Increase During Regeneration Show Enhancer Activity in Larvae (related to Figure 5) Many H3.3 peaks that increase or emerge during heart regeneration direct non-cardiac expression domains. The EGFP channel is shown for 2, 3 or 4 dpf larvae as labeled (bottom left). EGFP expression was detected at low levels in heart (white arrows) for (A, C, K). Expression in notochord (green), central nervous system (red), neuromasts (grey), skeletal muscle (blue) and fin fold (cyan) are indicated by colored arrows (see Table S3). Scale bar, 200 μm. |
Expression Data
Expression Detail
Antibody Labeling
Phenotype Data
Phenotype Detail
Acknowledgments
This image is the copyrighted work of the attributed author or publisher, and
ZFIN has permission only to display this image to its users.
Additional permissions should be obtained from the applicable author or publisher of the image.
Reprinted from Developmental Cell, 40, Goldman, J.A., Kuzu, G., Lee, N., Karasik, J., Gemberling, M., Foglia, M.J., Karra, R., Dickson, A.L., Sun, F., Tolstorukov, M.Y., Poss, K.D., Resolving Heart Regeneration by Replacement Histone Profiling, 392-404.e5, Copyright (2017) with permission from Elsevier. Full text @ Dev. Cell