
Fig. S3
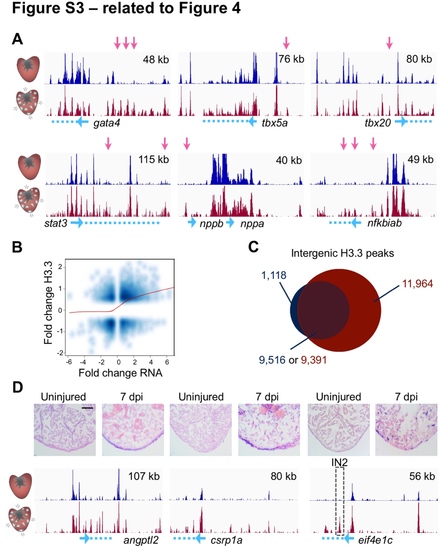
Dynamic H3.3 Enrichment Near Genes with Expression Changes During Regeneration (related to Figure 4) (A) Genome browser snapshots of uninjured (top track, dark blue) and regenerating (bottom track, dark red) H3.3 profiles are shown around genes previously known to be induced in CMs during regeneration. Pink arrows highlight differential H3.3 peaks. Genes are cartooned at the bottom in blue. Top right, x-axis. (B) Correlation of changes in RNAseq and changes in H3.3 occupancy (Pearson = 0.33). (C) Venn diagram showing there are 11,964 intergenic peaks that are detectable only in regenerating CMs versus uninjured CMs. These peaks emerge in the vicinity of 5,232 genes (see Table S2). (D) Extracellular matrix protein gene angptl2, transcription factor gene csrp1a, and translation elongation factor gene eif4e1c all have increased expression during regeneration. Peaks used to generate reporters are marked by a dashed box (see Figure S4). In situ hybridization signals (violet) appear to reflect increases observed in H3.3 enrichment during regeneration (bottom tracks). Scale bar, 125 μm. |
| Gene: | |
|---|---|
| Fish: | |
| Anatomical Terms: | |
| Stage: | Protruding-mouth |
Reprinted from Developmental Cell, 40, Goldman, J.A., Kuzu, G., Lee, N., Karasik, J., Gemberling, M., Foglia, M.J., Karra, R., Dickson, A.L., Sun, F., Tolstorukov, M.Y., Poss, K.D., Resolving Heart Regeneration by Replacement Histone Profiling, 392-404.e5, Copyright (2017) with permission from Elsevier. Full text @ Dev. Cell