
Fig. 2
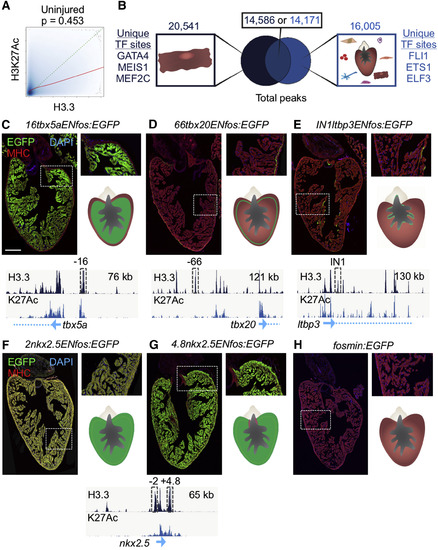
H3.3 Profiling Reveals Enhancer Elements that Direct Expression in CMs (A) H3.3 enrichment (x axis) and H3K27Ac enrichment (y axis) correlate (Pearson’s test, p = 0.454) in uninjured ventricles. The actual trend line between H3.3 and H3K27Ac is shown in red, and a hypothetical perfect correlation trend line is shown in dashed green. (B) Overlap of H3.3 (dark blue) and H3K27Ac (light blue) peaks from samples containing uninjured adult CMs. Top: the total peak numbers in each group. Predicted binding sites for transcription factors active in CMs (GATA4, MEIS1, MEF2C) were found in H3.3-only peaks. H3K27Ac-only peaks contained sequences homologous to binding sites of factors not recognized to be present in CMs (see Table S1). (C–H) H3.3 peaks near cardiac transcription factor genes identify transcriptional enhancers directing expression in different CM subtypes. Transgenic fish contained stable enhancer reporter constructs with the H3.3 peak subcloned upstream of the minimal c-fos promoter driving EGFP. The dashed gray box shows the cloned H3.3 peak from within the browser tracks. A DNA region 16 kb upstream of tbx5a (16tbx5aENfos:EGFP) directs EGFP in trabecular CMs (C). A region 66 kb upstream of tbx20 (66tbx20ENfos:EGFP) directs EGFP in CMs in the single CM-thick primordial layer (D). A region within the first intron of ltbp3 (IN1ltbp3ENfos:EGFP) directs expression sporadically in CMs adjacent to the endocardial cell layer (E). A region 2 kb upstream of nkx2.5 (2nkx2.5ENfos:EGFP) directs expression broadly in ventricular CMs and weakly in smooth muscle of the outflow tract (F). A region 5 kb downstream of the nkx2.5 transcription start site (4.8nkx2.5ENfos:EGFP) directs expression in all CMs except those adjacent to the valve (G). Control transgenic fish containing only the c-fos minimal promoter express little or no detectable cardiac EGFP (H). Scale bar, 200 μm. |
| Gene: | |
|---|---|
| Fish: | |
| Anatomical Terms: | |
| Stage: | Adult |
Reprinted from Developmental Cell, 40, Goldman, J.A., Kuzu, G., Lee, N., Karasik, J., Gemberling, M., Foglia, M.J., Karra, R., Dickson, A.L., Sun, F., Tolstorukov, M.Y., Poss, K.D., Resolving Heart Regeneration by Replacement Histone Profiling, 392-404.e5, Copyright (2017) with permission from Elsevier. Full text @ Dev. Cell