
Fig. S6
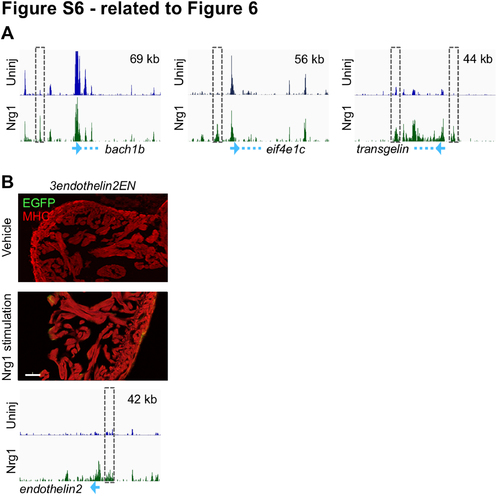
Regions that Increase in H3.3 Occupancy During Nrg1 Stimulation Mark CM Proliferation Enhancers (related to Figure 6) (A) Genome browser snapshots showing H3.3 enrichment from uninjured (top track, blue) and Nrg1-stimulated CMs (bottom track, green). Blue arrows at the bottom signify the promoter with the direction of transcription, and the dashed blue line is the location of the gene body. The size of the region displayed (x-axis) is indicated in the top right of the browser. Regions around these genes are the same as those in shown in Figure 4C, 4D and S4D. (B) EGFP fluorescence is not induced in 3endothelin2ENfos:EGFP animals during transgenic Nrg1 stimulation. An antibody against Myosin Heavy Chain (MHC, red) was used to stain cardiac muscle. Scale bar, 50 μm. |
Reprinted from Developmental Cell, 40, Goldman, J.A., Kuzu, G., Lee, N., Karasik, J., Gemberling, M., Foglia, M.J., Karra, R., Dickson, A.L., Sun, F., Tolstorukov, M.Y., Poss, K.D., Resolving Heart Regeneration by Replacement Histone Profiling, 392-404.e5, Copyright (2017) with permission from Elsevier. Full text @ Dev. Cell