
Fig. 4
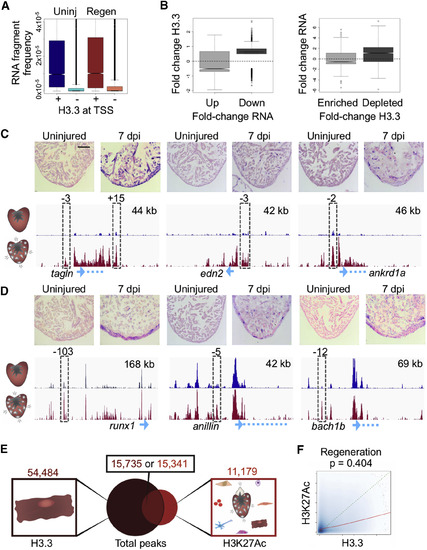
H3.3 Profiles Identify Genes Changing Expression during Regeneration (A) Promoters that contain H3.3 have an increased frequency of RNA expression. RNA-seq fragment frequencies in uninjured (blue) and regenerating (red) hearts correlate with score/height of the highest H3.3 peak at transcription start sites (TSS, ±2 kb). Kolmogorov-Smirnov test, p < 2.2 × 10⁻¹⁶ for each comparison (uninjured and regeneration). (B) Changes in H3.3 occupancy correlate with changes in mRNA abundance (RNA-seq). Left: fold change in enrichment of H3.3 in promoter regions for genes with increased (Up) or decreased (Down) expression during regeneration. Only fold changes with abs(log2(FC)) > 0.5 were considered. Right: fold change of gene expression for genes either enriched with or depleted of H3.3 at their promoter regions. False discovery rate <0.01. Pearson score (left to right): 0.064, −0.019, 0.043, 0.072. (C) In situ hybridization (ISH) evidence that emerging/increasing H3.3 peaks indicate changes in gene expression. Top: uninjured ventricular apices (left) show little detectable signal, whereas hearts 7 days after induction of ablation (7 dpi) indicate gene expression by a violet signal. Bottom: probes were designed toward transcripts highlighted in blue at the bottom of the genome browser shot. The tracks show enrichment of H3.3 from uninjured (blue) and regenerating (red) profiles (see STAR Methods). Peaks assayed for enhancer activity in transgenic reporters are indicated by a dashed gray box (see Figure S3). Genes with H3.3 increasing throughout the locus also mark genes that increase mRNA levels as gauged by ISH. Zebrafish smooth muscle actin (tagln), sarcomeric stress protein cardiac muscle ankyrin repeat domain 1a (ankrd1a), and hormone endothelin2 (edn2) have H3.3 increasing throughout gene bodies. Scale bar, 125 μm. (D) Transcription factors runx1 and bach1b, and cytokinesis factor anillin each have static H3.3 at TSSs (blue arrow) but increasing H3.3 at nearby putative enhancers, and each show regeneration-responsive ISH signals. Top right, x axis. See Figure S2 for other examples. Scale bar, 125 μm. (E) CM H3.3 and whole-ventricle H3K27Ac peak overlap during regeneration is similar to that from uninjured hearts (see Figure 2A). A total of 38,905 peaks are detected only by H3.3 enrichment. Total numbers of peaks are displayed at the top. (F) H3.3 enrichment (x axis) and H3K27Ac enrichment (y axis) correlate in regenerating ventricles (Pearson’s test, p = 0.404). The actual trend line between H3.3 and H3K27Ac is shown in red, and a hypothetical perfect correlation trend line is shown in dashed green. |
| Genes: | |
|---|---|
| Fish: | |
| Condition: | |
| Anatomical Term: | |
| Stage: | Adult |
Reprinted from Developmental Cell, 40, Goldman, J.A., Kuzu, G., Lee, N., Karasik, J., Gemberling, M., Foglia, M.J., Karra, R., Dickson, A.L., Sun, F., Tolstorukov, M.Y., Poss, K.D., Resolving Heart Regeneration by Replacement Histone Profiling, 392-404.e5, Copyright (2017) with permission from Elsevier. Full text @ Dev. Cell