
- Title
-
MicroRNA-126a Directs Lymphangiogenesis Through Interacting With Chemokine and Flt4 Signaling in Zebrafish
- Authors
- Chen, J., Zhu, R.F., Li, F.F., Liang, Y.L., Wang, C., Qin, Y.W., Huang, S., Zhao, X.X., Jing, Q.
- Source
- Full text @ Arterio., Thromb., and Vas. Bio.
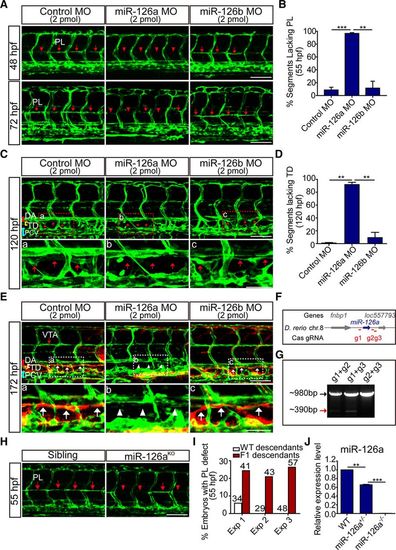
Silencing of miR-126a disrupts trunk lymphatic network formation. In all panels, head faces left, and dorsal is up; red and blue brackets indicate dorsal aorta (DA) and posterior cardinal vein (PCV), respectively. A, Confocal images of trunk vessels in 48 and 72 hours post fertilization (hpf) Tg(Fli1:eGFP)y1 embryos revealing a reduced formation of the parachordal lymphangioblast (PL) string (arrows) on miR-126a knockdown. Arrowheads denote the absence of PL. Scale bars, 100 μm. B, Quantification of PLs in control and miR-126aKD embryos at 55 hpf. PL formation was scored per somite in 10 consecutive somites between somites 5 and 15. n=1380, 1490, and 1300 for control morpholino (MO), miR-126a MO, and miR-126b MO, respectively. **P<0.01; ***P<0.001. C, Confocal images of trunk vessels in 120 hpf Tg(Fli1:eGFP)y1 embryos, showing normal thoracic duct (TD) formed in control and miR-126bKD embryo but not in miR-126aKD embryo. A–C, Top, Represent close-ups of the boxed areas. In all of these panels, arrows highlight the normal TD, and arrowheads denote the absence of TD. Scale bars, 100 μm (Top), and 50 μm (Bottom). D, Quantification of TD defects at 120 hpf. We quantitatively analyzed TD formation by scoring its presence in 10 consecutive somite segments (ie, from somite 5 to somite 15). n=1490, 1260, and 1080 for control MO, miR-126a MO, and miR-126b MO, respectively. **P<0.01. This experiment was performed 4×. E, Lymphangiography in 172 hpf Tg(Fli1:eGFP)y1 embryos revealed normal TD formed in control and miR-126bKD embryos (white arrows), but not in the miR-126aKD embryo (white arrowheads). A–C, Top, Represent close-ups of the boxed areas. Scale bars, 100 μm (Top), and 50 μm (Bottom). F, Diagram of Cas9/gRNA target sites around miR-126a genome sequence. G, Chromosomal deletions induced by Cas9 and 2 gRNAs targeting this locus. The polymerase chain reaction products of wild-type sequences (black arrow) and sequences with deletions induced by Cas9/gRNAs (red arrow) are indicated. H, Confocal images of trunk vessels in 55 hpf embryos showing PL defects in miR-126aKO F2 embryos. I, Quantification of the percentage of embryos with PL defects in F2 embryos at 55 hpf. J, Expression of miR-126a in wild-type (WT), miR-126+/−, miR-126−/− embryos. Data are mean and SEM; **P>0.01, ***P>0.005. VTA indicates vertebral artery. |

MiR-126a is expressed in lymphatic vessels. A, Whole-mount in situ hybridization (WISH) for miR-126a at different stage embryos. The head of embryos toward the left and the dorsal sides of the embryo are at the top of the figures. Scale bar, 200 μm. B, Cross-sectional images of miR-126a stained by WISH. Scale bars, 10 μm. C, Cross-sectional images of miR-126a stained by fluorescent in situ hybridization (FISH). Scale bars, 25 μm. D, Top, Trunk of miR-126bKD embryo at 48 hours post fertilization (hpf), stained by immunofluorescence (IF) for enhanced green fluorescent protein (EGFP) and by FISH for miR-126a. Bottom, Transverse sections through the trunk of a 120 hpf miR-126bKD embryo, stained by the same staining procedure as (Top). Scale bars, 25 μm. DA indicates dorsal aorta; DLAV, dorsal longitudinal anatomic vessel; ISV, intersegmental vessel; MO, morpholino; NC, Notochord; PAV, parachordal vessel; PCV, posterior cardinal vein; PL, parachordal lymphangioblast; and TD, thoracic duct. |
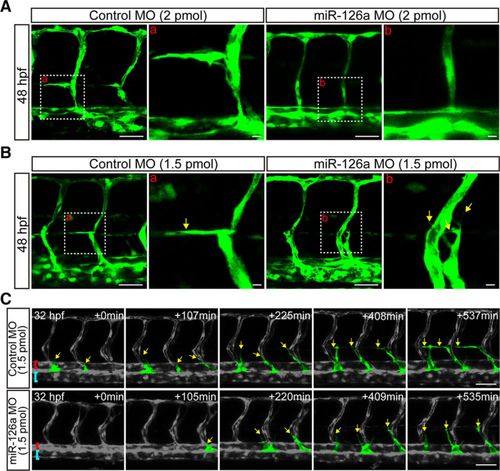
Deficiency of miR-126a blocks parachordal lymphangiblast (PL) extension along horizontal myoseptum. A, Confocal images of trunk vessels at 48 hours post fertilization (hpf) embryos showing no lymphangiogenic sprouts in miR-126a morphants (2 pmol). Scale bars, 40 μm. B, Confocal images of trunk vessels in 48 hpf embryos injected with control morpholino (MO; 1.5 pmol) or miR-126a MO (1.5 pmol) revealing the extension of PL was blocked by miR-126a knockdown. Scale bars, 40 μm. C, Still images from time-lapse analysis of control and miR-126aKD embryos. Time (min, begin at 32 hpf) is noted in the top right corner. Lateral views, dorsal is up, anterior to the left. Yellow arrows indicate the lymphatic endothelial cells (LECs) emerging from posterior cardinal vein (PCV). The extension along horizontal myoseptum of LECs was normal in control embryos, but this process was blocked in miR-126aKD embryos. Red brackets, dorsal aorta (DA); blue rackets, PCV. Scale bars, 50 μm. PHENOTYPE:
|
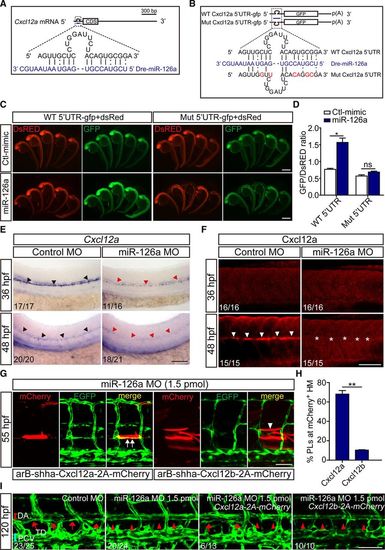
Cxcl12a is a direct functional target of miR-126a during parachordal lymphangiblast (PL) extension. A, Diagram of miR-126a target site residing in Cxcl12a mRNA 5′ untranslated region (UTR). B, Diagram of the 5′ UTR of the reporter used. C, In vivo reporter assays of the gfp mRNA bearing wild-type Cxcl12a mRNA 5′ UTR or mutated UTR coinjected with control mimic, miR-126a mimic at 24 hours post fertilization (hpf). dsred mRNA served as an internal control. D, Quantification of fluorescence density in embryos. The value of optical density was calculated by ImageJ. *P<0.05. E, Whole-mount in situ hybridization for Cxcl12a in 36 and 48 hpf embryos. The black arrowheads indicate normal expression; the red arrowheads highlight markedly reduction of Cxcl12a in miR-126aKD embryos. The penetrance of the indicated phenotype is shown in the bottom left of each picture. This assay was performed >5×. Scale bar, 200 μm. F, Immunofluorescence (IF) for Cxcl12a in 36 and 48 hpf embryos showing its dramatical decrease in 48 hpf miR-126aKD embryos. The penetrance of the indicated phenotype is shown in the bottom left of each picture. Scale bar, 100 μm. G, Confocal images of trunk vessels in 55 hpf embryos coinjected with miR-126a morpholino (MO) and Cxcl12a- or Cxcl12b-expressing plasmid revealing reformation of PL on Cxcl12a re-expression. White arrow indicates normal PL, and white arrowhead denotes the absence of PL. Scale bar, 100 μm. H, Quantification of PL reformation in embryos. n (from 4 independent biological replicates)=36 and 38 for Cxcl12a and Cxcl12b, respectively. (*P<0.05, Cxcl12a vs Cxcl12b). I, Confocal images of thoracic duct (TD) in 120 hpf embryos coinjected with miR-126a MO and Cxcl12a- or Cxcl12b-expressing plasmid revealing TD reformation on Cxcl12a re-expression. The penetrance of the indicated phenotype is shown in the bottom left of each picture. Scale bar, 100 μm. HM indicates horizontal myoseptum; and WT, wild type. |
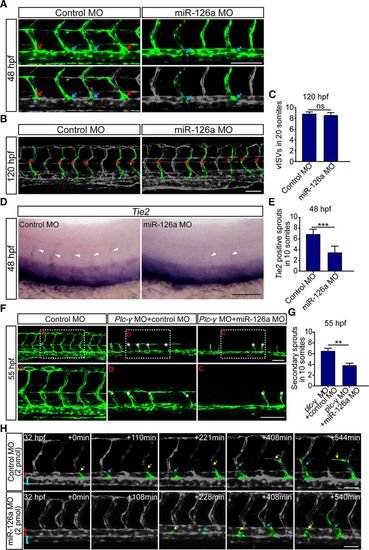
Knockdown of miR-126a perturbs lymphangiogenic sprouting but does not affect angiogenic sprouting. In all panels, the head of embryo faces left, and dorsal is up. A, Confocal images of trunk vessels in 48 hours post fertilization (hpf) embryos. The blue arrows indicate the connection of angiogenic posterior cardinal vein (PCV) sprouts to the primary intersegmental vessel (ISV). The red arrows show the lymphangiogenic sprouts. Scale bar, 100 μm. B, Confocal images of trunk vessels in 120 hpf embryos. Red asterisks indicate the venous ISV (vISV). Scale bar, 100 μm. C, Quantification of the vISV number in 120 hpf embryos showing no significant difference between control and miR-126aKD embryos. n (from 4 independent biological replicates)=61 and 60 for control morpholino (MO) and miR-126a MO, respectively. P value is 0.0917. D, Whole-mount in situ hybridization for Tie2 in 48 hpf embryos, which labeling all secondary sprouts (arrowheads) emerging from PCV. Scale bar, 100 μm. E, Quantification of the Tie2+ sprouts in control and miR-126a morphants. n=57 and 56 for control MO and miR-126a MO, respectively. ***P<0.001. This assay was performed 3×. F, Confocal images of 55 hpf control embryos, control/plc-γ double morphants, and miR-126a/plc-γ double morphants. White asterisks indicate secondary sprouts emerging from PCV. In miR-126a/plc-γ double-knockdown embryos, the number of secondary sprouts was significantly decreased. Bottom, Represent close-ups of the boxed areas in (Top). Scale bars, 100 μm. G, Quantification of PCV sprouts in control/plc-γ double morphants and miR-126a/plc-γ double morphants. n=154 and 170. *P<0.05; **P<0.01. H, Still images from time-lapse analysis of control and miR-126a morphants (2 pmol MO). Time (min, begin at 32 hpf) is noted in the top right corner. Yellow arrows indicate the lymphangiogenic sprouts emerging from PCV, and blue arrows indicate angiogenic PCV sprouts. Red brackets indicate dorsal aorta (DA), and blue brackets show PCV. Bars, 50 μm. |
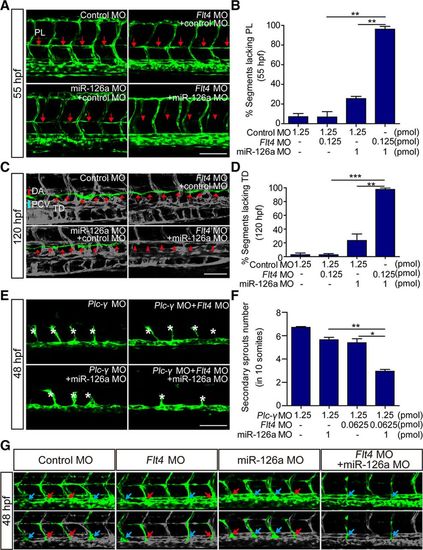
MiR-126a acts synergistically with Flt4 signaling to regulate lymphangiogenic sprouts formation. In all panels, the head of embryo faces left, and dorsal is up. A, Confocal images of trunk vessels at 55 hours post fertilization (hpf). Red arrows indicate normal parachordal lymphangioblast (PL), and red asterisks show the absence of PL. Scale bar, 100 μm. B, Quantification of the PL defects in control and miR-126aKD embryos at 55 hpf. n (from 3 independent biological replicates)=750, 1550, 980, and 1300 for control morpholino (MO), control MO+Flt4 MO, control MO+miR-126a MO, and miR-16a MO+Flt4 MO, respectively. Compared with single-knockdown groups, the PL was more severely impaired in double morphants (**P<0.01 vs Flt4 MO; **P<0.01 vs miR-126a MO). C, Confocal images of thoracic duct (TD) at 120 hpf. White arrows show the normal TD, and white arrowheads denote the absence of TD. Scale bar, 100 μm. D, Quantification of TD defects in control and miR-126a morphants at 120 hpf. Compared with single-knockdown groups, TD was more severely impaired in double morphants (***P<0.01 vs Flt4 MO; **P<0.01 vs miR-126a MO). E, Confocal images of trunk vessels in 48 hpf embryos injected with MOs. The secondary sprouts were dramatically reduced in miR-126a/Flt4/ Plc-γ triple-knockdown embryos. Scale bar, 100 μm. F, Quantification of posterior cardinal vein (PCV) sprouts defects in morphants at 48 hpf. n (from 4 independent replicates)=54, 49, 42, and 43 for Plc-γ MO, Plc-γ/miR-126a double MO, Plc-γ/Flt4 double MO, and Plc-γ/miR-16a/Flt4 triple MO, respectively. Compared with double-knockdown groups, PCV sprouts were more severely impaired in triple morphants (*P<0.01 vs Flt4/Plc-γ double MOs; **P<0.001 vs miR-126a/Plc-γ double MOs). G, Confocal images of trunk vessels in 48 hpf embryos showing normal angiogenic PCV sprouts. The blue arrows indicate the connection of angiogenic PCV sprouts to the primary intersegmental vessel (ISV). The red arrows show the lymphangiogenic PCV sprouts. Scale bar, 100 μm. DA indicates dorsal aorta. |
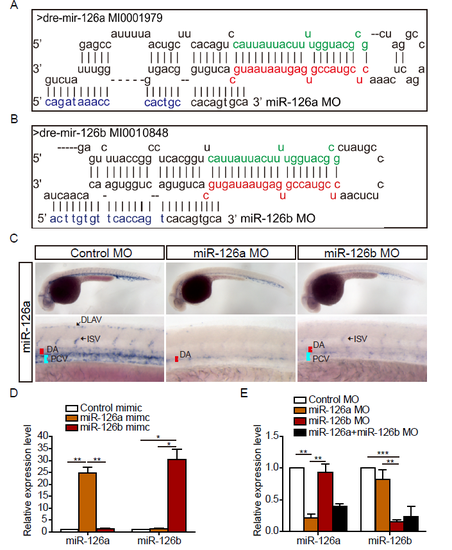
miR-126a and miR-126b could be specifically knocked down by morpholino. (A and B) Schematic alignment of miR-126a MO and miR-126b MO with pri-miR-126a and pri-miR-126b. The letters in green denote miR-126a* (miR-126a-5p) and miR-126b* (miR-126b-5p), respectively. The red letters indicate miR-126a (miR-126a-3p) and miR-126b (miR-126b-3p), respectively. The blue letters indicate the different nucleotides between miR-126a MO and miR-126b MO. (C) Whole-mount in situ hybridization (WISH) for miR-126a at 36 hpf embryos. DA: dorsal aorta; PCV: posterior cardinal vein; DLAV: dorsal longitudinal anatomic vessel; ISV: intersegmental vessel. (D) Quantification of mature miR-126a and miR-126b in 72 hpf embryos injected with mimics (0.4 pmol) indicating miR-126a and miR-126b could be specifically detected by real-time PCR. (E) Quantification of mature miR-126a and miR-126b in 72 hpf embryos injected with MOs (2 pmol of single MO, 1 pmol of each MO when co-injected). ***p<0.001, **p<0.001, *p<0.05. |
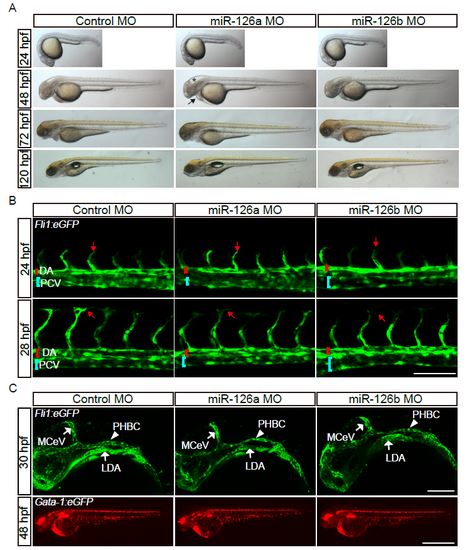
The gross morphology and the anatomic structure of early blood vessels are normal in miR-126a morphants. (A) Bright-field images of embryos injected with control MO (2 pmol), miR-126a MO (2 pmol) and miR-126b MO (2 pmol) showing normal gross morphology. Asterisk indicates brain development defects and arrow denotes pericardial edema. (B) Confocal images of trunk blood vascular in 24 and 28 hpf embryos illustrating normal angiogenesis. DA indicates dorsal aorta and PCV denotes posterior cardinal vein. The red arrow indicates migration of the tip cell. Scale bar, 100 μm. (C) Confocal images of head blood vascular in 30 hpf embryos, scale bar is 50 μm (Up panels). Stereomicroscope images of blood circulation in 48 hpf embryos, scale bar is 100 μm (Bottom panels). |
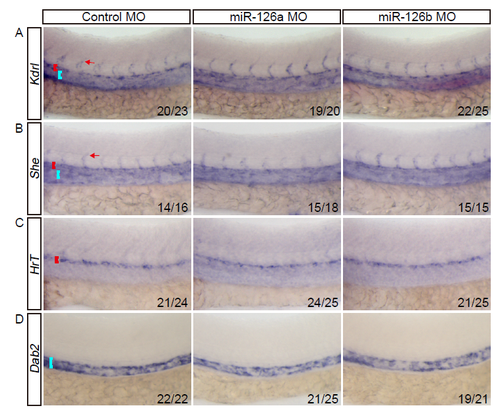
The expression of early blood vascular markers are not affected upon miR-126a knockdown. In all panels, head faces left and dorsal is up; red and blue brackets indicate DA and PCV respectively. The red arrow denotes intersegmental vessel (ISV). (A and B) Bright-field side views of the trunk of 28 hpf embryos stained by whole-mount in situ hybridization (WISH) for Kdrl and She both of which can mark all blood endothelial cells. (C and D) Bright-field side views of the trunk of 28 hpf embryos stained by WISH for arterial marker (in C) and venous marker (in D). |
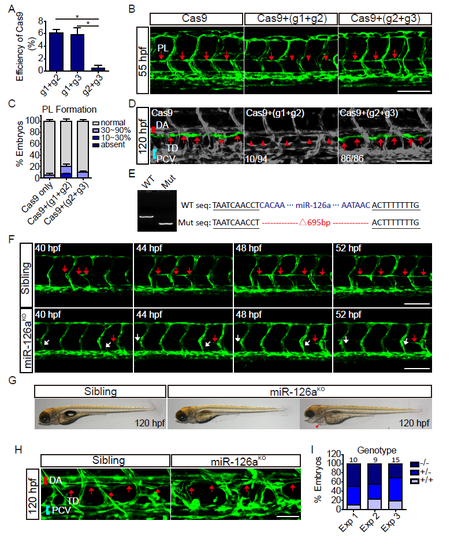
Knockout of miR-126a impairs trunk lymphatic network formation. (A) Assay of the deletion efficiency of Cas9 with two gRNAs pairs. (B) Confocal images of trunk vessels in 55 hpf embryos that were injected either with Cas9+gRNAs, or Cas9 alone. (C) Quantification of PLs in control and mosaic miR-126aKO embryos at 55 hpf. (D) Confocal images of TD in 120 hpf embryos that were either injected with Cas9+gRNAs, or Cas9 alone. (E) Identify of miR-126aKO F2 embryos with PCR and sequencing. Sequence with deletions induced by Cas9/gRNAs is indicated in right panel. WT: wild type; mut: mutant. (F) Confocal images of PL formation from 40 to 52 hpf. The red arrows indicate normal PLs development and the whites denote defective PL formation. (G) Bright-field side views of the gross morphology in 120 hpf embryos. Red arrowhead indicates edema. (H) Confocal images of TD in 120 hpf embryos. The red arrows denote normal TD. (I) A graph represents the genotype distribution of F2 embryos with PL defect. Scale bars, 100 μm. |
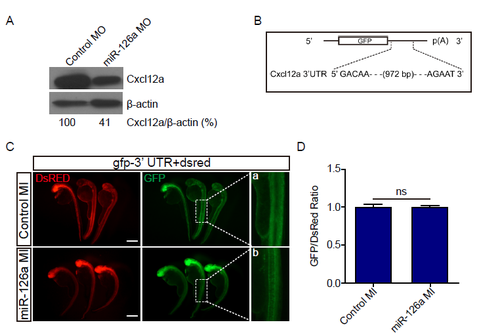
miR-126a can’t regulate Cxcl12a through targeting its 3'UTR. (A) Immunoblotting of Cxcl12a in embryos injected with indicated MOs at 48 hpf with anti-CXCL12 antibody; β-actin served as internal control. (B) Diagram the 3' UTR of the reporter used. (C) In vivo reporter assay of the gfp mRNA bearing wild-type Cxcl12a 3' UTR co-injected with control mimic (control MI), miR-126a mimic (miR-126a MI), dsred mRNA served as an internal control. Scale bar, 500 μm. Panels a and b represent close-ups of the boxed areas in right panels. (D) Quantification of fluorescence density ratio for GFP/DsRed in embryos. The value of optical density was calculated by ImageJ. |
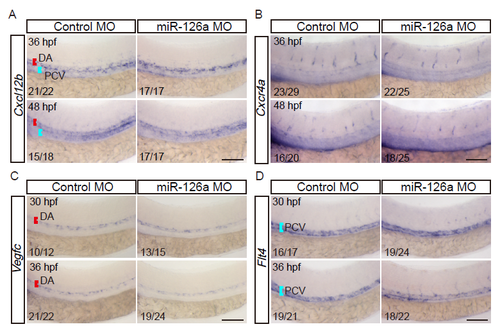
miR-126a is not required for the expression of Cxcl12b, Cxcr4a, Vegfc, and Flt4. (A and B) Whole-mount in situ hybridization of Cxcl12b and Cxcr4a in WT embryos injected with miR-126a MO or control MO at 36 and 48 hpf. The expressions of both are normal in miR-126a morphants. (C and D) Whole-mount in situ hybridization of Vegfc and Flt4 in WT embryos injected with miR-126a MO, or control MO at 30 and 36 hpf. Their expressions are normal in miR-126a morphants. Bars, 200 μm. |
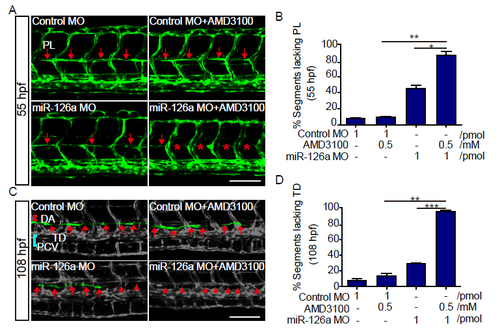
miR-126a acts synergistically with Cxcl12a signaling to regulate trunk lymphatics formation. (A) Confocal images of trunk vessels at 55 hpf embryos. The red arrows indicate the normal PLs and the red asterisks show the absence of PLs. (B) Quantification of PL defects in 55 hpf embryos. Compared with single knockdown groups, the PLs were more severely impaired in double knockdown group (**p<0.01 vs AMD3100; *p<0.01 vs miR-126a MO). (C) Confocal images of partial trunk vessels at 108 hpf embryos. Red lines, DA; blue lines, PCV; white arrows, normal TD; white arrowheads, absent TD. (D) Quantification of the TD defects in 108 hpf embryos. Compared with single knockdown groups, the TD was more severely impaired in double knockdown group (**p<0.01 vs AMD3100; ***p<0.001 vs miR-126a MO). Scale bars, 100 μm. |
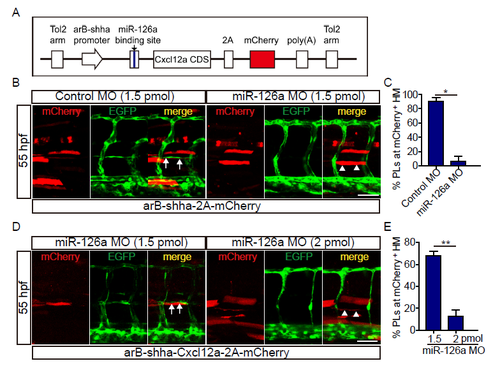
Cxcl12a re-expression could not rebuild the trunk lymphatic vessels under miR-126a’s dramatic knockdown. (A) Diagram of Cxcl12a rescue constructs for spatial overexpression of Cxcl12a accompanied with mCherry. (B) Confocal images of partial trunk vessels at 55 hpf embryos. White arrows indicate normally formed PL colocalization with Cxcl12a and white arrowheads denote absence of PL. Scale bar, 50 μm. (C) Quantification of the percentage of PL formed at mCherry positive HM at 55 hpf. Compared with 1.5 pmol control MO group, the PL in 1.5 pmol miR-126a MO group was severely absent upon mCherry expression. *p<0.05. (D) Confocal images of partial trunk vessels at 55 hpf embryos. White arrows indicate reformed PL colocalization with Cxcl12a and white arrowheads denote absence of PL. Scale bar, 50 μm. (E) Quantification of the percentage of PL formed at mCherry positive HM at 55 hpf. Compared with 1.5 pmol MO knockdown group, the PL in 2 pmol MO group was more severely absent upon Cxcl12a re-expression. **p<0.01. |