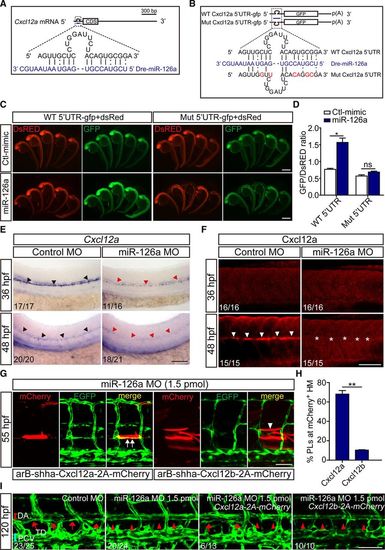
Cxcl12a is a direct functional target of miR-126a during parachordal lymphangiblast (PL) extension. A, Diagram of miR-126a target site residing in Cxcl12a mRNA 5′ untranslated region (UTR). B, Diagram of the 5′ UTR of the reporter used. C, In vivo reporter assays of the gfp mRNA bearing wild-type Cxcl12a mRNA 5′ UTR or mutated UTR coinjected with control mimic, miR-126a mimic at 24 hours post fertilization (hpf). dsred mRNA served as an internal control. D, Quantification of fluorescence density in embryos. The value of optical density was calculated by ImageJ. *P<0.05. E, Whole-mount in situ hybridization for Cxcl12a in 36 and 48 hpf embryos. The black arrowheads indicate normal expression; the red arrowheads highlight markedly reduction of Cxcl12a in miR-126aKD embryos. The penetrance of the indicated phenotype is shown in the bottom left of each picture. This assay was performed >5×. Scale bar, 200 μm. F, Immunofluorescence (IF) for Cxcl12a in 36 and 48 hpf embryos showing its dramatical decrease in 48 hpf miR-126aKD embryos. The penetrance of the indicated phenotype is shown in the bottom left of each picture. Scale bar, 100 μm. G, Confocal images of trunk vessels in 55 hpf embryos coinjected with miR-126a morpholino (MO) and Cxcl12a- or Cxcl12b-expressing plasmid revealing reformation of PL on Cxcl12a re-expression. White arrow indicates normal PL, and white arrowhead denotes the absence of PL. Scale bar, 100 μm. H, Quantification of PL reformation in embryos. n (from 4 independent biological replicates)=36 and 38 for Cxcl12a and Cxcl12b, respectively. (*P<0.05, Cxcl12a vs Cxcl12b). I, Confocal images of thoracic duct (TD) in 120 hpf embryos coinjected with miR-126a MO and Cxcl12a- or Cxcl12b-expressing plasmid revealing TD reformation on Cxcl12a re-expression. The penetrance of the indicated phenotype is shown in the bottom left of each picture. Scale bar, 100 μm. HM indicates horizontal myoseptum; and WT, wild type.
|
