
Fig. 1
- ID
- ZDB-FIG-161221-34
- Publication
- Chen et al., 2016 - MicroRNA-126a Directs Lymphangiogenesis Through Interacting With Chemokine and Flt4 Signaling in Zebrafish
- Other Figures
- All Figure Page
- Back to All Figure Page
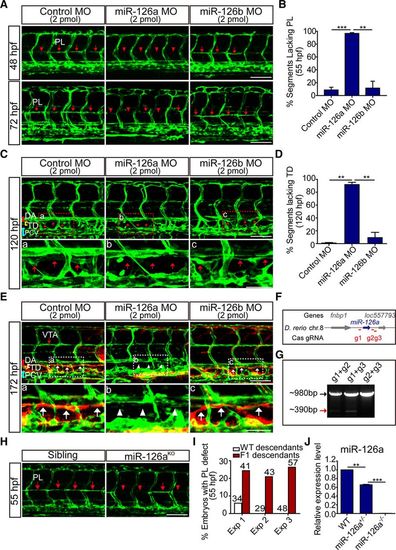
Silencing of miR-126a disrupts trunk lymphatic network formation. In all panels, head faces left, and dorsal is up; red and blue brackets indicate dorsal aorta (DA) and posterior cardinal vein (PCV), respectively. A, Confocal images of trunk vessels in 48 and 72 hours post fertilization (hpf) Tg(Fli1:eGFP)y1 embryos revealing a reduced formation of the parachordal lymphangioblast (PL) string (arrows) on miR-126a knockdown. Arrowheads denote the absence of PL. Scale bars, 100 μm. B, Quantification of PLs in control and miR-126aKD embryos at 55 hpf. PL formation was scored per somite in 10 consecutive somites between somites 5 and 15. n=1380, 1490, and 1300 for control morpholino (MO), miR-126a MO, and miR-126b MO, respectively. **P<0.01; ***P<0.001. C, Confocal images of trunk vessels in 120 hpf Tg(Fli1:eGFP)y1 embryos, showing normal thoracic duct (TD) formed in control and miR-126bKD embryo but not in miR-126aKD embryo. A–C, Top, Represent close-ups of the boxed areas. In all of these panels, arrows highlight the normal TD, and arrowheads denote the absence of TD. Scale bars, 100 μm (Top), and 50 μm (Bottom). D, Quantification of TD defects at 120 hpf. We quantitatively analyzed TD formation by scoring its presence in 10 consecutive somite segments (ie, from somite 5 to somite 15). n=1490, 1260, and 1080 for control MO, miR-126a MO, and miR-126b MO, respectively. **P<0.01. This experiment was performed 4×. E, Lymphangiography in 172 hpf Tg(Fli1:eGFP)y1 embryos revealed normal TD formed in control and miR-126bKD embryos (white arrows), but not in the miR-126aKD embryo (white arrowheads). A–C, Top, Represent close-ups of the boxed areas. Scale bars, 100 μm (Top), and 50 μm (Bottom). F, Diagram of Cas9/gRNA target sites around miR-126a genome sequence. G, Chromosomal deletions induced by Cas9 and 2 gRNAs targeting this locus. The polymerase chain reaction products of wild-type sequences (black arrow) and sequences with deletions induced by Cas9/gRNAs (red arrow) are indicated. H, Confocal images of trunk vessels in 55 hpf embryos showing PL defects in miR-126aKO F2 embryos. I, Quantification of the percentage of embryos with PL defects in F2 embryos at 55 hpf. J, Expression of miR-126a in wild-type (WT), miR-126+/−, miR-126−/− embryos. Data are mean and SEM; **P>0.01, ***P>0.005. VTA indicates vertebral artery. |
| Fish: | |
|---|---|
| Knockdown Reagents: | |
| Observed In: | |
| Stage Range: | Long-pec to Days 7-13 |