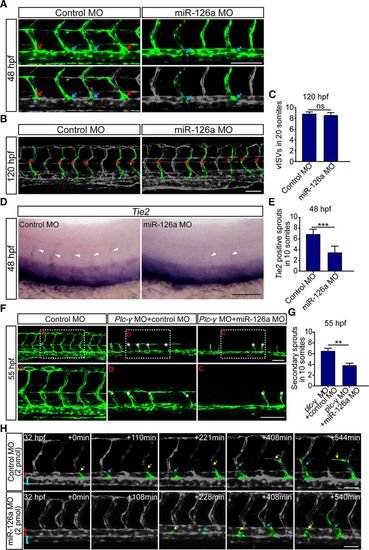
Knockdown of miR-126a perturbs lymphangiogenic sprouting but does not affect angiogenic sprouting. In all panels, the head of embryo faces left, and dorsal is up. A, Confocal images of trunk vessels in 48 hours post fertilization (hpf) embryos. The blue arrows indicate the connection of angiogenic posterior cardinal vein (PCV) sprouts to the primary intersegmental vessel (ISV). The red arrows show the lymphangiogenic sprouts. Scale bar, 100 μm. B, Confocal images of trunk vessels in 120 hpf embryos. Red asterisks indicate the venous ISV (vISV). Scale bar, 100 μm. C, Quantification of the vISV number in 120 hpf embryos showing no significant difference between control and miR-126aKD embryos. n (from 4 independent biological replicates)=61 and 60 for control morpholino (MO) and miR-126a MO, respectively. P value is 0.0917. D, Whole-mount in situ hybridization for Tie2 in 48 hpf embryos, which labeling all secondary sprouts (arrowheads) emerging from PCV. Scale bar, 100 μm. E, Quantification of the Tie2+ sprouts in control and miR-126a morphants. n=57 and 56 for control MO and miR-126a MO, respectively. ***P<0.001. This assay was performed 3×. F, Confocal images of 55 hpf control embryos, control/plc-γ double morphants, and miR-126a/plc-γ double morphants. White asterisks indicate secondary sprouts emerging from PCV. In miR-126a/plc-γ double-knockdown embryos, the number of secondary sprouts was significantly decreased. Bottom, Represent close-ups of the boxed areas in (Top). Scale bars, 100 μm. G, Quantification of PCV sprouts in control/plc-γ double morphants and miR-126a/plc-γ double morphants. n=154 and 170. *P<0.05; **P<0.01. H, Still images from time-lapse analysis of control and miR-126a morphants (2 pmol MO). Time (min, begin at 32 hpf) is noted in the top right corner. Yellow arrows indicate the lymphangiogenic sprouts emerging from PCV, and blue arrows indicate angiogenic PCV sprouts. Red brackets indicate dorsal aorta (DA), and blue brackets show PCV. Bars, 50 μm.
|
