- Title
-
Cardiac contraction activates endocardial Notch signaling to modulate chamber maturation in zebrafish
- Authors
- Samsa, L.A., Givens, C., Tzima, E., Stainier, D.Y., Qian, L., Liu, J.
- Source
- Full text @ Development
|
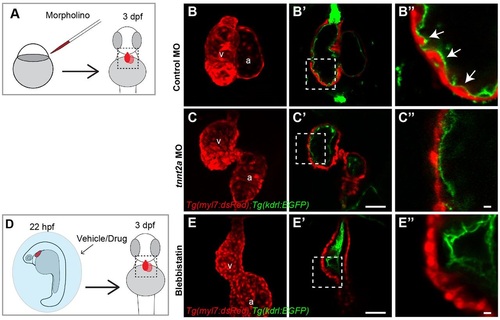
Cardiac contraction is required for myocardial trabeculation. (A,D) Schematic diagrams of (A) morpholino (MO) injection at one-cell stage or (D) pharmacological inhibition of cardiac contraction (6µM blebbistatin) from 22hpf. The morpholino-injected or chemical-treated Tg(kdrl:EGFP); Tg(myl7:dsRed) double transgenic embryos were allowed to develop further and examined for cardiac trabecular phenotypes at 3dpf. (B,C,E) Maximal projection of confocal z-stacks reveals the overall shape of the heart. (B′,C′,E′) Mid-chamber confocal optical section of the same hearts shown in B,C,E. (B′′,C′′,E′′) Magnified high-resolution images of the cardiac regions marked by dotted lines in B′,C′,E′. White arrows point to trabeculae. a, atrium; v, ventricle. Scale bars: 50µm in C′,E′ 10µm in C′′,E′′. EXPRESSION / LABELING:
PHENOTYPE:
|
|
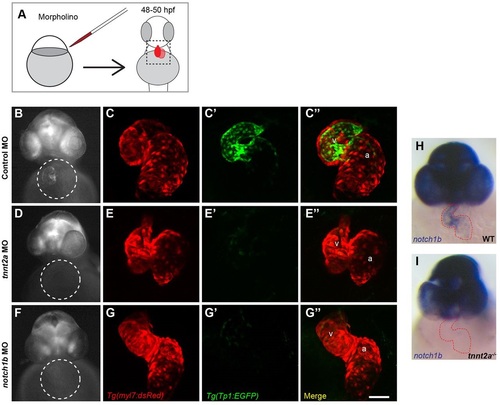
Cardiac contraction is required for endocardial Notch activation and notch1b transcription. (A) Schematic diagram of morpholino (MO) gene knockdown experiment, in which double transgenic Tg(Tp1:EGFP); Tg(myl7:dsRed) embryos were injected with (B,C) control, (D,E) tnnt2a or (F,G) notch1b morpholinos and imaged at 48-50hpf. (B,D,F) Representative whole-mount images of Notch reporter with cardiac regions highlighted by circles. (C,E,G) Confocal maximal intensity projections of the hearts shown in (B,D,F) with cardiomyocytes labeled in red, (C′,E′,G′) Notch reporters in green and (C′′,E′′,G′′) colocalized signal in yellow. Minimal colocalization indicates that Notch activation is in endocardial cells. (H,I) Whole-mount notch1b riboprobe hybridization in (H) control and (I) tnnt2a-/- embryos, with the heart outlined in red. Scale bar: 50µm. a, atrium; v, ventricle. |
|
Notch activation in the ventricular endocardium. (A-F) Confocal z-stack maximal intensity projection of hearts from double transgenic Tg(Tp1:VenusPest); Tg(myl7:dsRed) embryos at designated time points, with Tp1:VenusPest expression in green and cardiomyocytes marked in red. Scale bar: 50µm. a, atrium; v, ventricle. |
|
Cardiac contraction promotes trabeculation through notch1b-efnb2a-nrg1 epistasis. (A,B,C) Mid-chamber confocal optical section of Tg(myl7:dsRED); Tg(kdrl:EGFP) double transgenic (A) control, (B) notch1b and (C) efnb2a morphant (MO) hearts, showing cardiomyocytes in red and endocardial cells in green. (A′,B′,C′) Magnified high-resolution images of the cardiac regions highlighted by dotted lines in A,B,C. (D-F) Expression of notch1b, efnb2a and nrg1 in hearts isolated from (D) tnnt2a, (E) notch1b and (F) efnb2a morphants compared, normalized to expression in control morphant hearts (dashed line). *P≤0.05-0.01, **P≤0.01-0.001, ***P<0.001 compared with control morphants (one-sample t-test compared with control morpholino fold change=1). Error bars are s.e.m. White arrows point to trabeculae. Scale bars: 50µm in C; 10µm in C′. EXPRESSION / LABELING:
PHENOTYPE:
|
|
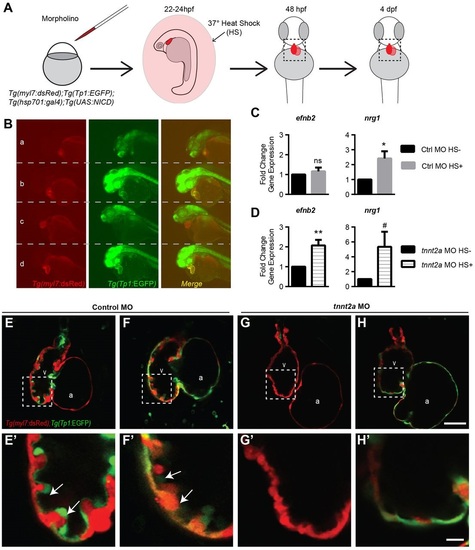
Notch1 activation rescues efnb2a and nrg1 expression in non-contractile hearts. (A) Experimental schematic diagram of morpholino injection and heat-shock overexpression of NICD. qRT-PCR and imaging were performed to examine gene expression and trabecular phenotype at 2-3 and 4dpf, respectively. (B) Representative whole-mount images of cardiomyocytes (red) and Notch reporter (green) in (a,b) control and (c,d) tnnt2a morphants at 48hpf (a,c) without or (b,d) with NICD overexpression. (C,D) Expression of efnb2a and nrg1 in hearts isolated from (C) control morphants and (D) tnnt2a morphants, comparing gene expression in embryos with or without NICD overexpression. (E-H) Confocal mid-chamber optical section of 4dpf hearts, with dotted lines marking the inset magnified in E2-H2. #P≤0.075-0.05, *P≤0.05-0.01, **P≤0.01-0.001, ***P<0.001 compared with control morphants (one-sample t-test compared with control morpholino fold change=1). Error bars are s.e.m. White arrows highlight trabeculae. a, atrium; HS, heat shock control without NICD overexpression; HS+, heat shock control with NICD overexpression; NICD, Notch intracellular domain; v, ventricle. Scale bars: 50µm in H; 10µm in H′. |
|
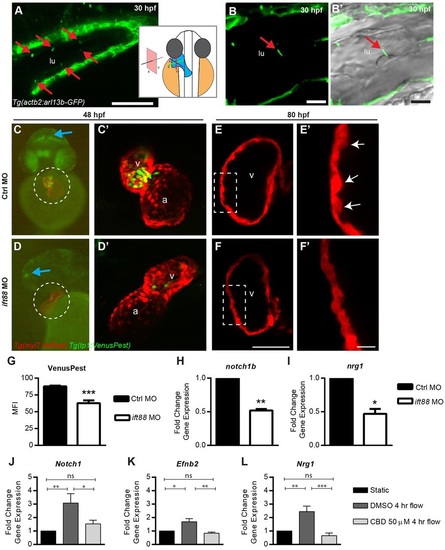
Shear stress promotes notch1 expression in a primary cilia-dependent manner. (A-B′) The hearts of Tg(actb2:Arl13b-GFP) embryos were examined by confocal microscopy to assess localization of primary cilia in the endocardium. (A) Tg(actb2:Arl13b-GFP) reporter expression in the heart. The schematic diagram indicates the orientation of the heart and confocal section relative to the whole embryo at 30hpf. (B) High-resolution view of a Tg(actb2:Arl13b-GFP) embryo merged with (B′) a bright field image demonstrating colocalization of the primary cilium base with an endocardial cell. (C,D) Whole-mount Tg(myl7:dsRed); Tg(Tp1:VenusPest) double transgenic (C) control and (D) ift88 morphants (MO) at 48hpf. The hearts are marked with dashed circles. (C′,D′) Confocal maximal projection of the heart from the individual embryos shown in C,D, overlaying cardiomyocytes (red) and Notch reporter (green). (E,F) Confocal optical section of the (E) control and (F) ift88 morphant embryo cardiomyocytes (red) at 80hpf. The insets marked by the dotted rectangle were magnified in E′,F′. (G) Quantification of ventricular Notch reporter (EGFP) MFI from whole-mount embryos at 48hpf. (H,I) Relative expression of (H) notch1b and (I) nrg1 in control and ift88 morphant hearts. (J-L) Expression of (J) Notch1, (K) Efnb2 and (L) Nrg1 in DMSO- or 50µM CBD-treated MLECs that were exposed to 2 dyn/cm2 shear stress for 4h compared with static DMSO- and CBD-treated controls. Red arrows highlight Arl13b-GFP in the endocardium. Blue arrows highlight Notch reporter signal in neural tissue. White arrows highlight trabeculae. *P≤0.05-0.01, **P≤0.01-0.001, ***P<0.001 compared with control morphants (one-sample t-test compared with 1.0-fold change or Student′s t-test). Error bars are s.e.m. Scale bars: 50µm in A; 10µm in B,B′,F&prime& 100µm in F. a, atrium; CBD, ciliobrevin D; lu, lumen; MFI, mean fluorescence intensity; v, ventricle. EXPRESSION / LABELING:
PHENOTYPE:
|


