
Fig. 4
- ID
- ZDB-IMAGE-160203-9
- Genes
- Publication
- Samsa et al., 2015 - Cardiac contraction activates endocardial Notch signaling to modulate chamber maturation in zebrafish
- All Figures
- Figures for Samsa et al., 2015
|
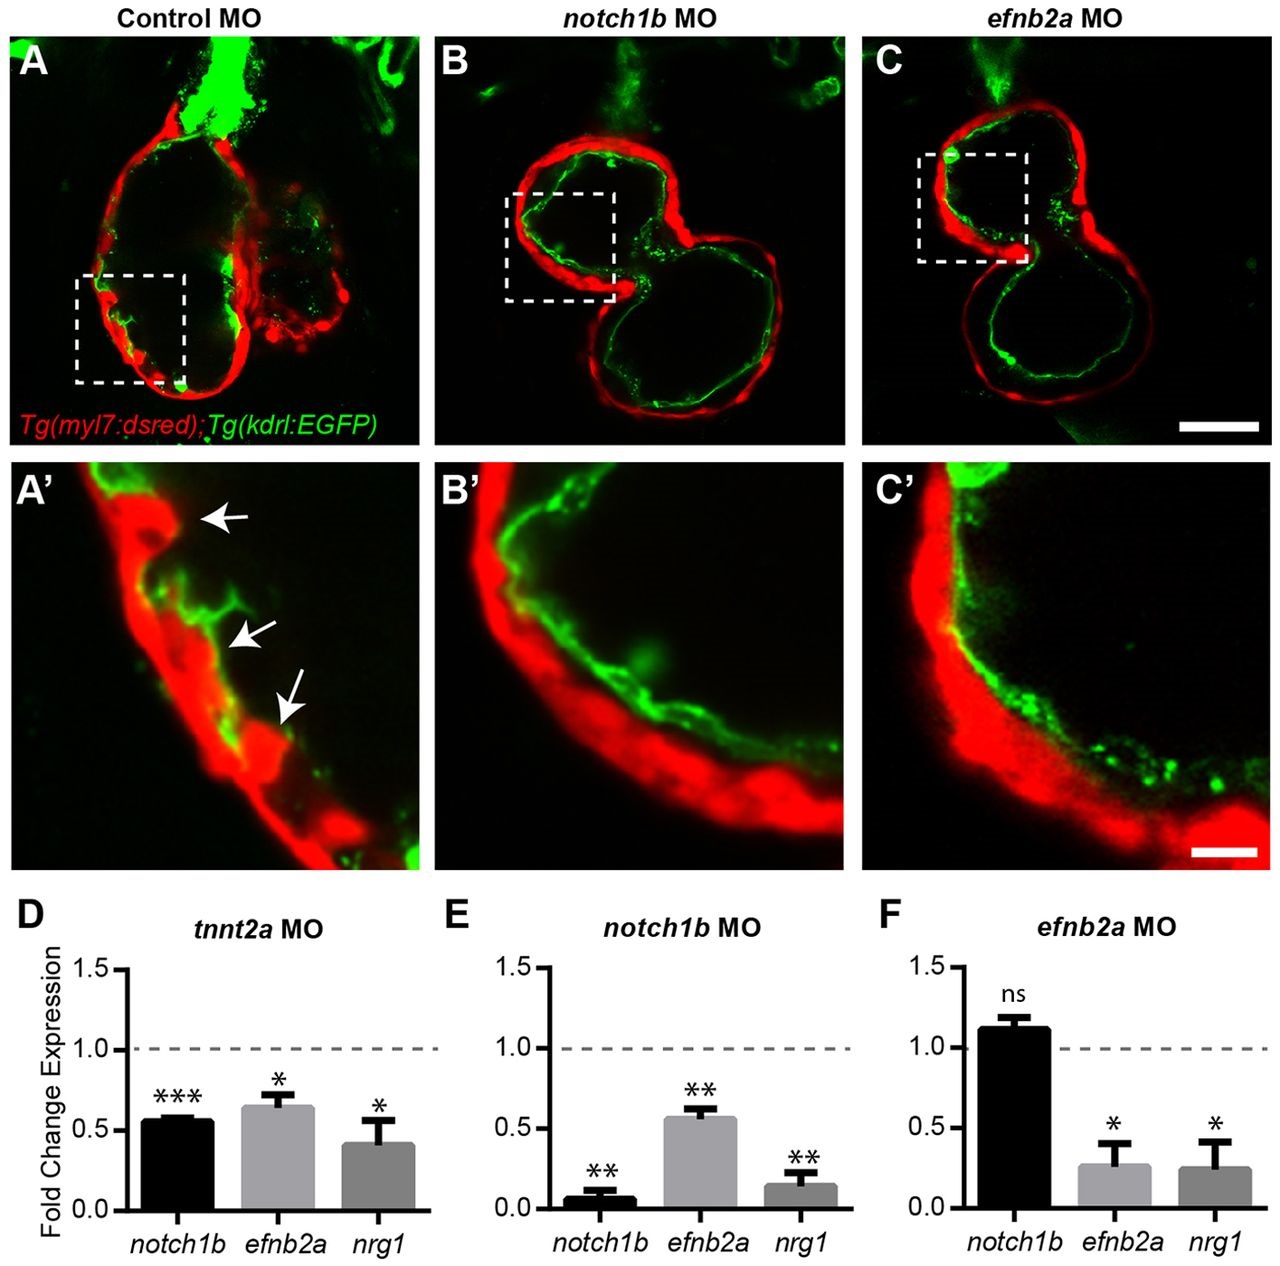
Fig. 4
Cardiac contraction promotes trabeculation through notch1b-efnb2a-nrg1 epistasis. (A,B,C) Mid-chamber confocal optical section of Tg(myl7:dsRED); Tg(kdrl:EGFP) double transgenic (A) control, (B) notch1b and (C) efnb2a morphant (MO) hearts, showing cardiomyocytes in red and endocardial cells in green. (A′,B′,C′) Magnified high-resolution images of the cardiac regions highlighted by dotted lines in A,B,C. (D-F) Expression of notch1b, efnb2a and nrg1 in hearts isolated from (D) tnnt2a, (E) notch1b and (F) efnb2a morphants compared, normalized to expression in control morphant hearts (dashed line). *P≤0.05-0.01, **P≤0.01-0.001, ***P<0.001 compared with control morphants (one-sample t-test compared with control morpholino fold change=1). Error bars are s.e.m. White arrows point to trabeculae. Scale bars: 50µm in C; 10µm in C′.