- Title
-
Maternal Vsx1 plays an essential role in regulating prechordal mesendoderm and forebrain formation in zebrafish
- Authors
- Xu, X., He, Y., Sun, L., Ma, S., Luo, C.
- Source
- Full text @ Dev. Biol.
|
Comparison of spatial relationship patterns of PME, axial mesoderm, neural plate and epidermis in different types of embryos at bud stage. The neural plate and epidermis boundary is marked by dlx3b, PME is marked by hgg1 and axial mesoderm is marked by ntl. (B, F, J, N) Dorsal-animal views with anterior towards the top. (C, G, K, O) Lateral views with animal towards the top. (D, H, L, P) Dorsal views with animal towards the top. The injected reagents are indicated at the left of each column. The border between neural plate and epidermis is emphasized by black dots. Black brackets indicate the distance between anterior prechordal plate and posterior notochord. Red brackets indicate the length of notochord. Arrowheads indicate the anterior position of PME. Note that in vsx1 tbMO and ntl MO coinjected embryos, the anterior migration of hgg1 expression domain and the extension of ntl expression domain are recovered, but the lateral expansion of ntl expression domain is still the same as that in vsx1 morphants. |
|
Maternal Vsx1 is essential for PME formation and progression. (A, B, D, E G, H) whole-mount in situ hybridization analysis of ntl (purple) and gsc (brown) expression in wild-type, vsx1 tbMO injected, vsx1 tbMO and ntl MO coinjected embryos at 40% epiboly. (C-C′, F-F′, I-I′) Cellular morphology and position of the anterior mesendoderm cells in wild-type, vsx1 tbMO injected, vsx1 tbMO and ntl MO coinjected embryos at 60% epiboly, observed by a confocal microscope. C′, F′ and I′ are the magnified image of C, F and I, respectively. The injected reagents are indicated at the left of each column. (A, D, G) Dorsal views with animal towards the top. (B, E, H) Animal views with dorsal towards the right. (C-C′, F-F′, I-I′) lateral views at the shield region with animal towards the top and dorsal towards the right. The arrowheads indicate the leading edge cells of the mesendoderm. e, h and y indicate epiblast, hypoblast and yolk sac, respectively. The bars represent 20 µm. EXPRESSION / LABELING:
PHENOTYPE:
|
|
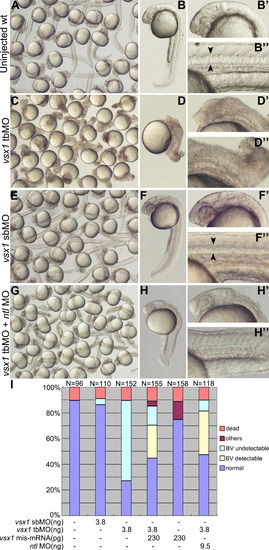
Maternal Vsx1 is essential for head formation and patterning in zebrafish. (A-H′′) Phenotype comparison of uninjected wild-type (A-B′′), vsx1 tbMO injected (C-D′′), vsx1 sbMO injected (E-F′′), vsx1 tbMO and ntl MO coinjected embryos at 24 hours post fertilization. The single images of embryos are presented in their lateral views with anterior to the top and dorsal to the right. The injected reagents are indicated at the left of each column. (B′, D′, F′, H′) and (B′′, D′′, F′′, H′′) are the magnified images of B, D, F and H at the head region and trunk region, respectively. Two arrowheads indicate the width of the notochord. Note that the vsx1 tbMO injected embryo is severely dorsalized, and the vsx1 tbMO and ntl MO coinjected embryo exhibits normal brain ventricles with no distinguishable notochord. (I) Proportion of different phenotypes in different experiments at 24 hpf. The injected reagents and their amounts are indicated at the bottom. Numbers of examined embryos are indicated at the top. BV: brain ventricle. PHENOTYPE:
|
|
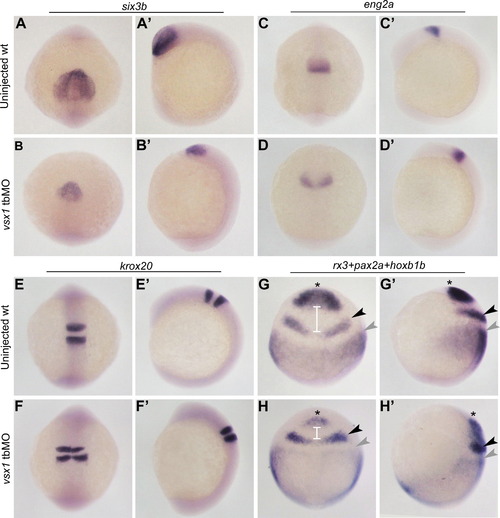
Maternal Vsx1 knockdown specifically inhibits forebrain formation. (A-F′) Expression patterns of six3b, eng2a and krox20 in uninjected wild-type and vsx1 tbMO injected embryos at 8-10 somite embryos. (G-H′) Comparison of relative expression levels and spatial patterns of forebrain marker rx3, mid-hindbrain boundary marker pax2a and hindbrain marker hoxb1b at bud stage. Brackets in G and H indicate the distance between forebrain region and mid-hindbrain boundary. Asterisks indicate the anterior end of forebrain. Black arrowheads indicate the location of mid-hindbrain boundary and gray arrowheads indicate the location of hindbrain. (A-H) Dorsal views with animal to the top. (A′-H′) Lateral views with animal to the top. The injected reagents are indicated at the left of each column. Riboprobes are indicated at the top of each group of figures. EXPRESSION / LABELING:
PHENOTYPE:
|
|
Impaired PME formation and progression resulted in aberrant forebrain formation. (A, D, G) Phenotype comparison of uninjected (A), vsx1 tbMO injected (D) and vsx1 tbMO and dkk1 mRNA coinjected embryos (G) at 8-10 somite stage. Brackets show the distance between head and tail. Note that the forebrain formation is restored with a shortened AP axis and anterior neural plate marker is expressed in more posterior positions in vsx1 tbMO and dkk1 mRNA coinjected embryos. (B-C′, E-F′, H, H′) Whole-mount in situ hybridization of anterior neuroectoderm marker rx3 and PME marker hgg1 at bud stage. (B, C, E, F, H) Dorsal-animal views with anterior to the top. (B′, C′, E′, F′, H′) Lateral views with animal to the top. (I) Proportion of brain phenotypes in different experiments at 24 hpf. The injected reagents and their amounts are indicated at the bottom. Numbers of examined embryos are indicated at the top. |
|
Expression of PME and forebrain markers in vsx1 knockdown, vsx1 and ntl double knockdown embryos at bud stage. (A-L) Dorsal-animal views with anterior towards the top. (A′-L′) Lateral views with animal towards the top. The injected reagents are indicated at the top of images. Riboprobes are indicated at the left side of images. EXPRESSION / LABELING:
|
|
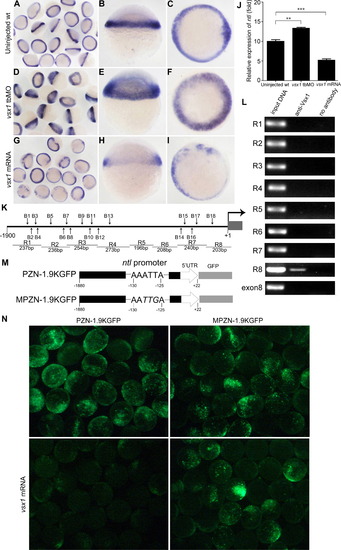
Maternal Vsx1 directly represses ntl ectopic expression. (A-I) Expression of ntl in uninjected wild-type (A-C), vsx1 tbMO-injected (D-F) and vsx1 mRNA-injected (G-I) embryos at 30% epiboldy. (B, E, H) Dorsal views with animal towards the top. (C, F, I) Animal views with dorsal towards the right. (J) Real-time quantitative RT-PCR analysis of ntl expression in vsx1 knockdown or overexpression embryos compared to uninjected wild-type embryos. Results are expressed as mean±SEM, and statistical analyses were done by unpaired t test. **P<0.01. ***P<0.001. (K) The position of potential Vsx1 binding sites at ntl proximal promoter region. B1-B18 indicates the potential binding sites of Vsx1. R1-R8 represents the examined regions in ChIP assay. (L) ChIP assay on extracts from wild-type embryos. Input is a positive control with sonicated original genomic DNA fragment. No antibody immunoprecipitates are used as negative controls for ChIP assay specificity. These results show the specific recruitment of Vsx1 by ntl promoter region 8. (M) Diagram of GFP reporters driven by wild-type or mutant fragments of the ntl proximal promoter. (N) GFP expression driven by wild-type or mutant fragments of the ntl proximal promoter. The types of GFP reporter sensors are shown at the top of the images and the coinjected mRNA is shown at the left of the images. EXPRESSION / LABELING:
|
Reprinted from Developmental Biology, 394(2), Xu, X., He, Y., Sun, L., Ma, S., Luo, C., Maternal Vsx1 plays an essential role in regulating prechordal mesendoderm and forebrain formation in zebrafish, 264-76, Copyright (2014) with permission from Elsevier. Full text @ Dev. Biol.


