
- Title
-
smarce1 mutants have a defective endocardium and an increased expression of cardiac transcription factors in zebrafish
- Authors
- Castillo-Robles, J., Ramírez, L., Spaink, H.P., Lomelí, H.
- Source
- Full text @ Sci. Rep.

(A) Schematic diagram of smarce1 gene. The DNA-binding high mobility group is shown. CRISPR/Cas9 mediated-deletions were produced in exon IV. The nucleotide sequence of the RNA-guide targeted region is shown in gray with the PAM in red and the deletions are indicated in lines below. (B) The body curvature, smaller eyes and cardiac edema are shown. (C) Graphs showing rescue experiments with injected smarce1 mRNA. A significant lower number of edematous embryos (left) and a higher survival rate (right) were determined in groups of the mRNA-injected relative to buffer-injected embryos. Values represent the average of three independent injections of 100 ± 10 embryos per experiment. ***P < 0.001. PHENOTYPE:
|

Morphological defects in smarce1 mutants. (A) The heart morphological defects of mutated embryo can be appreciated in comparison with a heart from a normal sibling (arrow) at 72 hpf. B-C. Sagittal sections stained with hematoxylin-eosin from 96 hpf normal (B) and mutant (C) embryos. (D–F) Confocal Z-projections of cmlc2:GFP/smarce1 normal (D) and defective hearts (E,F) at 72 hpf. In F nuclei were stained with DAPI. A: atria, AVC: atrio-ventricular canal, EC: endocardium, Ht: heart, V: ventricle. Scale bars: 25 μm. EXPRESSION / LABELING:
PHENOTYPE:
|
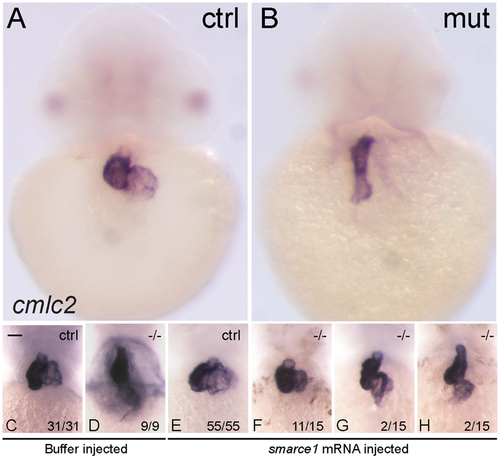
Rescue of the heart looping by smarce1 mRNA injection in smarce1 mutant embryos. Whole-mount in situ hybridization detects transcripts for the cardiomyocyte marker cmlc2. A-B. Embryos at 48 hpf showing a normal heart (A) and a smarce1−/− heart with a defective looping (B). (C–H) Analysis of heart looping at 72 hpf. Buffer injected embryos present a normal heart in control siblings (C) and a non-looped heart in all the mutants (D). (E–H) smarce1 mRNA injected embryos showing the rescue of the heart looping in the mutant embryos. Complete rescue is shown in (F); a partial rescue in (G); and the failing of rescue in (H). Scale bars: 50 μm. EXPRESSION / LABELING:
PHENOTYPE:
|

Patterns of expression of atria and ventricle markers in smarce1 mutants. Chamber expression in smarce1 heterozygous (upper panel) and homozygous (lower panel) embryos. Left to right: 48 hpf embryos showing the expression of the ventricular cardiomyocyte marker vmhc, embryos showing the expression of the atria cardiomyocyte marker amhc, 72 hpf embryos stained with MF20 and S46 antibodies to detect the ventricle (red) and atrium (green) in wildtype and mutant embryos. Scale bar: 25 μm. EXPRESSION / LABELING:
PHENOTYPE:
|
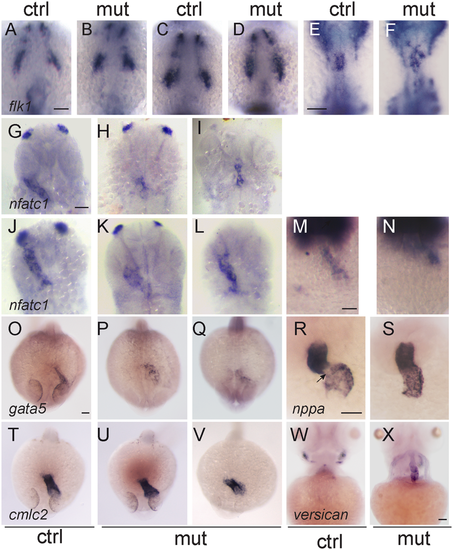
Defects in the endocardium in smarce1 mutants. Embryos at 9- (A,B), 14- (C,D) and 20- (E,F) somite stage showing the expression the endothelial marker flk1. While a normal ALPM pattern is observed in mutant embryos up to 14 somites, at 20 somite stage mutant embryos present an abnormal distribution of endocardial cells. Expression of nfatc1 in embryos at 26 (G-I), 30 (J–L) and 35 hpf (M,N) reveals a disorganized pattern of the endocardium. Embryos at 24 hpf showing expression of the endocardial marker gata5 (O–Q) and the myocardial marker cmlc2 (T–V). Expression of gata5 in the endocardium of the mutant embryos is abnormal and has a lower signal. A dysmorphic pattern for cmlc2 is detected in one out of six embryos (V). R,S. Expression of nppa in 48 hpf embryos. An arrow shows the absence of nppa at the atrioventricular junction. (W, X) Expression of versican in embryos at 4 dpf. Scale bars: 50 μm. EXPRESSION / LABELING:
PHENOTYPE:
|
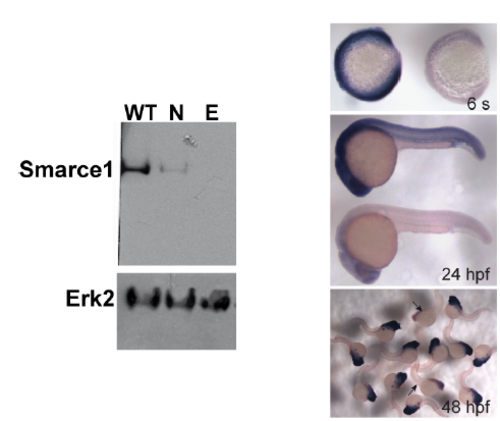
Left panel. Western blot with SMARCE1 antibody from 4 dpf wild type embryos (WT), normal looking embryos derived from a smarce1+/- intercross (N) and their edematous siblings (E). Right panel. Gene expression pattern of smarce1 in progenies derived from a smarce1+/- intercross at the indicated stages (s = somites). Embryos with fade signal (arrows) were determined to be smarce1-/- homozygous. |
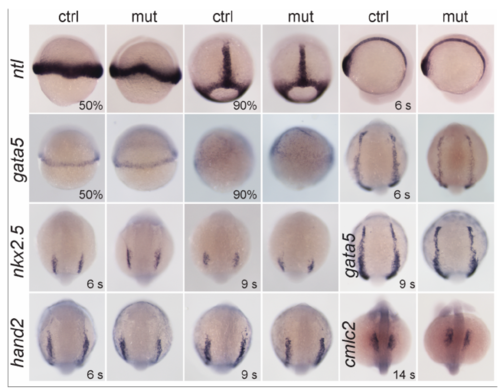
Gene expression patterns in control and smarce1-/- embryos for the indicated transcripts at the indicated stages (s = somites). Embryos at 50%, and 90% epiboly, dorsal views with anterior to the top. Embryos at 6-somite stage for ntl, lateral views. Embryos at 6-, 9- and 14-somite stage for gata5, hand2, nkx2.5 and cmlc2, dorsal views with anterior to the top. |

Upper panel, left. Quantitation by qPCR of gene expression of gata5, nkx2.5, the smarcd3 genes and ntl. 24 hpf embryos were genotyped and evaluated. For all genes n ≥3. No significant fold change was detected. Right. Quantitation by qPCR of gata5 gene expression in isolated hearts of 4 dpf defective embryos compared to hearts of normal siblings indicated a significant difference (P value = 0,0087). Lower panel. Expression of gata5, smarce1, nppa and nkx2.5 in 4 dpf (smarce1) and 5 dpf (all other markers) normal and defective larvae detected by ISH (lateral views). |