
IMAGE
Fig. S4
- ID
- ZDB-IMAGE-181130-30
- Publication
- Castillo-Robles et al., 2018 - smarce1 mutants have a defective endocardium and an increased expression of cardiac transcription factors in zebrafish
- All Figures
- Figures for Castillo-Robles et al., 2018
Image
|
Figure Caption
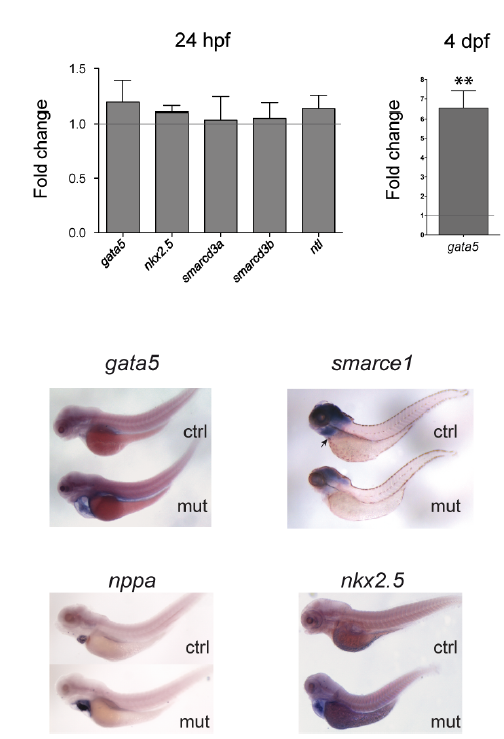
Fig. S4
Upper panel, left. Quantitation by qPCR of gene expression of gata5, nkx2.5, the smarcd3 genes and ntl. 24 hpf embryos were genotyped and evaluated. For all genes n ≥3. No significant fold change was detected. Right. Quantitation by qPCR of gata5 gene expression in isolated hearts of 4 dpf defective embryos compared to hearts of normal siblings indicated a significant difference (P value = 0,0087). Lower panel. Expression of gata5, smarce1, nppa and nkx2.5 in 4 dpf (smarce1) and 5 dpf (all other markers) normal and defective larvae detected by ISH (lateral views).
Acknowledgments
This image is the copyrighted work of the attributed author or publisher, and
ZFIN has permission only to display this image to its users.
Additional permissions should be obtained from the applicable author or publisher of the image.
Full text @ Sci. Rep.